Best High-Yield Bond Funds For 2015 – Part 3
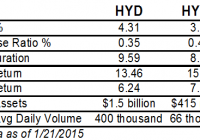
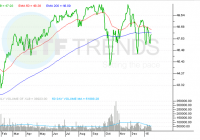
Summary HYD has a higher yield and lower credit quality. HYMB has higher credit quality and better total return history. HYMB has large exposure to California. In part one , we compared the two largest high-yield bond funds: iShares iBoxx $ High Yield Corporate Bond (NYSEARCA: HYG ) and SPDR Barclays Capital High Yield Bond (NYSEARCA: JNK ). In part two , we compared two short-term high-yield bond funds: PIMCO 0-5 Year High Yield Corporate Bond (NYSEARCA: HYS ) and SPDR Barclays Short Term High Yield Bond (NYSEARCA: SJNK ). In part three, we will look at the offerings in the high-yield municipal bond space: SPDR Nuveen S&P High Yield Municipal Bond (NYSEARCA: HYMB ), Market Vectors High-Yield Municipal Index (NYSEARCA: HYD ) and the much newer Market Vectors Short High-Yield Municipal Index (NYSEARCA: SHYD ). Index & Strategy HYD tracks the Barclays Municipal Custom High Yield Composite Index while HYMB tracks the S&P Municipal Yield Index. HYD was created in February 2009, HYMB in April 2011. These two funds have a correlation of 0.9836. On the expense ratio, HYMB has an asterisk because it is currently subsidized through October 31, 2015. Without the subsidy, the expense ratio would be 0.50 percent (the yield would also dip 0.05 percent). On volume, HYD’s price is half that of HYMB, so dollar volume is about three times higher for HYD. HYD has a higher yield, lower expenses and longer average duration. As we’ve seen when comparing other high-yield ETFs, total returns have favored the funds with shorter durations, lower yields and higher credit quality. As for the latter, HYD has 30 percent of assets in BBB rated debt; 22 percent in BB; and 17 percent in B. HYMB has superior credit quality, with 21 percent of assets in A rated debt; 22 percent in Baa; and 33 percent below Baa. Both portfolios have about one-quarter of assets in unrated debt. Both funds give a geographic breakdown of their assets as well. HYMB has 14.2 percent of assets in California, while HYD has only 8.9 percent in the state. HYMB’s next largest state is Texas, with 7.5 percent of assets, while HYD’s second largest holding is NY with 8.5 percent of assets. One other option out there is Market Vectors Short High-Yield Municipal Index. The fund tracks the Barclays Municipal High Yield Short Duration Index. It has an expense ratio of 0.35 percent and a yield of 3.10 percent. It has a duration of 4.17 years. The fund is overweight Texas, at 10.5 percent of assets. Credit quality is 48 percent in BBB rated debt; 16 percent in BB; 10 percent in B; and 2 percent in CCC. It has higher credit quality than HYD. The fund has only $80 million in assets and trades about 20,000 shares per day. SHYD had only one year of history, with an inception date in January 2014. Performance The price ratio chart of HYD and HYMB shows HYD in a persistent downtrend, signifying under performance. However, there are two clear periods when HYD outperformed: summer 2011 and summer 2013, while under performing in July 2014. (click to enlarge) Summer 2011 was a period when investors worried about sovereign debt in the U.S. and Europe, getting to the point where people were discussing a U.S. Treasury default. In summer 2013, Detroit declared bankruptcy , while in summer 2014, Puerto Rican bonds sold off sharply. This shows that the portfolios have deviated substantially when volatility increases. A performance chart shows that only the Detroit bankruptcy led to significant price declines. (click to enlarge) Income HYMB has a 30-day SEC yield of 3.83 percent versus HYD’s 4.31 percent yield. As has been the case with other high-yield funds, falling interest rates have weighed on the fund’s payouts. (click to enlarge) Risk & Reward Compared to the Barclays Municipal Index, HYD has a beta of 1.50 and HYMB has a beta of 1.61. Investors are taking on more market risk with these funds as compared to aggregate muni bond funds and the beta reflects this. The Barclays Municipal Index has a standard deviation of 3.72. HYD has a standard deviation of 6.24 and HYMB a standard deviation of 6.42. These standard deviations are higher than any of the junk bonds previously covered in parts one and two. This is due to the volatility surrounding Detroit’s bankruptcy in 2013. High-yield corporate bonds have enjoyed a smoother ride over the past three years and this is reflected in their lower standard deviation. Bloomberg’s ranking of states by their underfunded pensions shows a wide gap between the states when it comes to financial management. Between HYD and HYMB, the one state that sticks out is California. While most state exposure is similar, California accounts for 5 percentage points more of HYMB’s assets. Investors with a strong opinion on California’s long-term finances can opt for one fund over the other, but for other states, single state exposure is not as large a concern. Conclusion Municipal debt is not out of the woods because unfunded liabilities will eventually become a public debt if the municipality doesn’t go bust first. In the long-run, that favors HYMB’s superior credit quality-assuming California isn’t one of the problem states in the future. As for 2015, municipal bonds appear to be in good shape. Investor interest in municipal bonds recovered in 2014 after a drop in 2013. The Federal Reserve Z1 report shows municipal debt was $2.999 trillion in 2009, and as of Q3 2014, that number fell to $2.908 trillion. State and local governments have been slowly repaying their debt, leaving many states in a stronger financial position than they were six years ago. Liabilities such as unfunded pensions are a concern in states that haven’t addressed the problem, but overall the supply of muni debt has stayed constant as the economy has grown. While the municipal bond market looks attractive next to corporate junk bonds in terms of risk/reward, PIMCO 0-5 Year High Yield Corporate Bond (covered in part two) appears more attractive for 2015 given it has declined since the summer along with high-yield corporate bonds. If the economy stays strong in 2015, HYS is likely to recover and deliver some capital appreciation. It lacks energy exposure, which could struggle if the U.S. dollar continues its rally in 2015, and that could help it beat other high-yield bonds funds this year.