Tag Archives: transactionname

Cornerstone Total Return: Yield Illusion Creates Substantial Downside

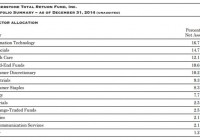
Summary CRF trades at a ~40% premium to NAV. Rich valuation driven by retail investors’ perception of high dividend yield. However, the yield is predominately just a return of investors’ own capital. Background on Closed End Funds A closed-end fund is a publicly traded investment company that raises a fixed amount of capital, and is then structured, listed and traded like a stock on a stock exchange. Whereas conventional mutual funds and ETFs frequently redeem / issue new shares to ensure that the price per share remains in line with the net asset value of the underlying holdings in the funds, this is not the case for CEFs. Rather the share price of CEFs is driven by the market forces of supply and demand, and can at times trade at either large discounts or premiums to NAV of the funds’ actual holdings. This is particularly the case given that the natural investor base for CEFs tends to be small, retail investors that in some cases do not fully understand the products that they are investing in. The Cornerstone Total Return Fund (NYSEMKT: CRF ) is one extreme example, which currently trades at among the most significant premiums to NAV in the CEF universe. Overview of CRF CRF is managed by Cornerstone Advisors, and is composed of a broadly diversified portfolio of stocks, with the largest holdings being some U.S. blue chips. A more comprehensive overview can be viewed in the fund’s annual report : (click to enlarge) (click to enlarge) Source: CRF 2014 Annual Report CRF’s expense ratio (based on 2014 figures) has been just over 1.4% of NAV. Unsustainable Yield Despite the relatively traditional composition of the fund, CRF currently pays a monthly dividend of $0.332 (equating to an annual yield of ~16.6%, or ~23% of the fund’s NAV). You might be asking yourself how this could be possible. The answer is simply that the bulk of the dividend is coming from a return of capital rather than ordinary income/capital gains. In other words, investors are being returned their own money in the fund. (click to enlarge) Source: CRF 2014 Annual Report. Note that per share figures in the table above do not reflect the one-for-four reverse stock split in Dec 2014. Unsurprisingly, the fund’s NAV has declined in turn, as shown in the chart below. (click to enlarge) Source: Yahoo Finance Rich Premium to NAV So now the question is, what do you think is the fair value of this CEF? I certainly wouldn’t pay any premium to NAV for a vanilla portfolio of equities with a ~1.4% expense ratio. Rather, I would prefer to buy a much cheaper ETF like SPY and simply sell part of the holdings each year if I needed the income. But apparently many retail investors disagree (institutional holdings of CRF stand at ~1%, according to Nasdaq), and have been lured in by the siren’s song of this CEF’s “dividend.” In fact CRF is currently trading at a 40% premium to NAV (and has been even higher in some past years). In other words, investors are willing to pay more than $1.40 for each $1 of the fund’s net assets. (click to enlarge) Source: CEF Connect Conclusion Though I hold a small short position in CRF, this is admittedly somewhat speculative given that the fund has in the past traded at any even more extreme premium to NAV, and the borrow cost has been in the mid-single to double digits. However, retail investors should be mindful of the risks that come with owning CEFs trading far above NAV. Disclosure: The author is short CRF. (More…) The author wrote this article themselves, and it expresses their own opinions. The author is not receiving compensation for it (other than from Seeking Alpha). The author has no business relationship with any company whose stock is mentioned in this article.

Will The Fed Push Back Down GLD?

Summary The FOMC will convene again next week. If the FOMC hints about raising rates anytime soon, this could drag down GLD. The recovery of the U.S. dollar and rise in long-term treasury yields will keep pressuring down GLD. The recent strong labor report brought up the odds of the FOMC coming closer towards raising rates. It also cooled down the gold market. Nonetheless, the SPDR Gold Trust ETF (NYSEARCA: GLD ) is still flat for the year even though the U.S. dollar and long-term yields have picked up again in recent weeks. The FOMC isn’t expected to make any big changes in the upcoming meeting. But the price of GLD could start coming down again if the FOMC even drops a hint about raising rates in its upcoming meeting. The better-than-expected non-farm payroll report along with the sharp rise in JOLTS – number of job openings reached 5.38 million while market expectations were set at 5.03 million – have both driven a bit higher the implied probabilities of a rate hike in September to 33% and for December to 70%. The FOMC will convene on June 16-17 and release the press statement on June 17 accompanied with a press conference and release updated economic outlook. On the one hand, the GDP contracted back in Q1 and inflation is still contained below 2%. On the other hand, the U.S. labor market continues to show recovery, and there are possible speculative bubbles in the housing and stock markets, which could be popped once interest rates start to rise again. In the meantime, even though the FOMC is considering normalizing its monetary policy, this doesn’t mean the M2 isn’t growing – as of May, M2 is up by 5.3% year on year. This higher M2 comes despite the tumble in oil prices in the past few months. But the rise in M2, which is another indication for the changes in U.S. inflation, hasn’t driven up the price of GLD in recent years, as presented in the chart below. Moreover, the core PCE , which is the indicator the FOMC follows, has gone down to 1.2% – the lowest level in over a year. This low level doesn’t vote well for the FOMC to turn hawkish in the coming meeting. (click to enlarge) Source: FRED, Google Finance Despite the rise in M2, the U.S. money base remained relatively flat and rose by only 0.7% year over year. But this hasn’t resulted in a sharp rise in the money base as it was the case back when the FOMC implemented QE1, QE2, and QE3. After ending QE3, the FOMC only continued purchasing new bonds to substitute expiring bonds in order to maintain its big balance sheet. Thus, it would take a 180-degree change in the FOMC’s policy for the gold market to heat up again. The weakness of the Euro and other major currencies mainly due to ECB’s QE program, the Greek bailout talks also play a minor role in keeping the Euro weak, is likely to further drive up the U.S. dollar, which doesn’t help the price of gold or the price of GLD. Another factor that could keep slowly bringing down GLD is the recovery of long-term treasury yields, which have picked up in recent weeks. The correlations among GLD and long-term yields, as seen below, are negative and strong and suggest that if yields keep rising, GLD could also start to come down. (click to enlarge) Source: U.S Department of Treasury and Bloomberg Final note The upcoming FOMC meeting could be another nail in the gold market’s coffin – especially if the FOMC turns more hawkish by improving its outlook and providing a clearer picture about raising rates. Currently, the market doesn’t expect the FOMC to make any major changes to the policy and the Fed could remain dovish, which helps to keep GLD from tumbling. The major shift is only likely to occur closer to the end of the year – when the FOMC is more likely to raise rate, assuming the U.S. economy continues to progress in its current pace. Until then, the stronger U.S. dollar and higher long-term treasury yields are likely to keep GLD slowly dwindling. For more, please see: 3 Questions About Gold Disclosure: The author has no positions in any stocks mentioned, and no plans to initiate any positions within the next 72 hours. (More…) The author wrote this article themselves, and it expresses their own opinions. The author is not receiving compensation for it (other than from Seeking Alpha). The author has no business relationship with any company whose stock is mentioned in this article.

Bargain Energy Funds To Buy As Crude Shows Uptrend

There aren’t many individuals who don’t like a good bargain. Most, or perhaps everyone, loves a great deal and such a bargain is now available in the energy sector. After the rout in crude prices last year, prices have stabilized, and crude is now gaining ground, making the sector a safer investment option. The fundamentals driving the price of the commodity look good, and thus buying energy funds at the current discount would be a prudent move. The word “downturn” fits perfectly for the energy sector. Crude prices had slumped to below $50 a barrel. Thus, the profit margins of several players from the industry have seen massive declines. This has hit stock prices as well. Nevertheless, this has made their stocks inexpensive and a really good bargain. Funds with strong fundamentals owning potential gainers from the energy sector should do well going forward, somewhat illustrated by their year-to-date gains. Before we cherry pick the energy funds, let’s look at other details. Fundamentals Driving Crude Since last June – when oil was trading around $100 per barrel – we saw a prolonged plunge in crude. This was primarily owing to the plentiful North American shale supplies when nobody seemed interested in buying, sluggish growth in China, and a dull European economy. However, the fundamentals are improving now. U.S. Energy Department’s weekly inventory release showed that crude stockpiles fell for the fifth straight week despite domestic production notching up to another record. The federal government’s EIA report revealed that crude inventories fell by 1.95 million barrels for the week ending May 29, 2015, following a decrease of 2.80 million barrels in the previous week. But the real booster should be felt on the demand side. The peak summer driving season in the U.S. – started officially this past Memorial Day weekend – and should fuel up crude consumption. According to the American Automobile Association (AAA) and IHS Global Insight, about 37.2 million travelers were forecasted to have traveled by air and road during the Memorial Day weekend. If the prediction is to be believed, then this Memorial Day weekend might have been the busiest in a decade, with the highest travel volume since 2005. Moreover, we have seen Asian demand for crude increasing. As per Energy Aspects – an independent research consultancy firm in U.K. – notwithstanding a slowing economy in China, the country’s crude import touched a record 7.4 million barrels per day in April. Additionally, according to the Ministry of Finance, customs-cleared oil imports in Japan hiked 9.1% from last April to 3.62 million barrels per day in April 2015. The improving fundamentals – as reflected in growing demand and lower supply – are reflected in the recent West Texas Intermediate (WTI) crude price of $59.72 per barrel, up significantly from the six-year low mark of $43.88 per barrel in March 2015. 3 Energy Mutual Funds to Buy Here we will list 3 Energy mutual funds that either carry a Zacks Mutual Fund Rank #1 (Strong Buy) or Zacks Mutual Fund Rank #2 (Buy). Remember, the goal of the Zacks Mutual Fund Rank is to guide investors to identify potential winners and losers. Unlike most of the fund-rating systems, the Zacks Mutual Fund Rank is not just focused on past performance, but the likely future success of the fund. The following funds are rebounding from 1-year loss and have encouraging year-to-date gains. Fidelity Select Energy Portfolio (MUTF: FSENX ) seeks capital growth over the long run. FSENX invests a lion’s share of its assets in companies involved in the energy sector including oil, gas, electricity, and solar power. FSENX primarily focuses on acquiring common stocks of companies throughout the globe. Factors such as financial strength and economic condition are considered before investing in a company. FSENX currently carries a Zacks Mutual Fund Rank #1. Its year-to-date gain is 8.8% as against 12.3% decline over 1-year period. The 3- and 5-year annualized returns stand at 7.9% and 8.5%. The annual expense ratio is 0.79% as compared to category average of 1.44%. FSENX carries no sales load. Guinness Atkinson Alternative Energy (MUTF: GAAEX ) seeks capital growth over the long term. GAAEX invests heavily in domestic and foreign companies from the alternative energy sector. GAAEX invests in companies regardless of their market capitalization and may also invest in developing economies. GAAEX currently carries a Zacks Mutual Fund Rank #2. Its year-to-date gain is 11.7% as against 7.1% decline over 1-year period. The 3-year annualized return stands at 16.7%. The annual expense ratio of 1.98% is, however, higher than the category average of 1.44%. GAAEX carries no sales load. Fidelity Advisor Energy T (MUTF: FAGNX ) invests in common stocks and in certain precious metals. The fund normally invests at least 80% of assets in securities of companies principally engaged in owning or developing natural resources, or supply goods and services to such companies, or in physical commodities. FAGNX currently carries a Zacks Mutual Fund Rank #1. Its year-to-date gain is 8.7% as against 12.6% decline over 1-year period. The 3- and 5-year annualized returns stand at 6.1% and 6.4%. The annual expense ratio is 1.34% as compared to category average of 1.44%. Original Post