Tag Archives: transactionname

Backtesting With Synthetic And Resampled Market Histories

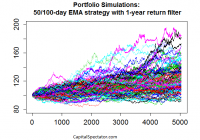
We’re all backtesters in some degree, but not all backtested strategies are created equal. One of the more common (and dangerous) mistakes is 1) backtesting a strategy based on the historical record; 2) documenting an encouraging performance record; and 3) assuming that you’re done. Rigorous testing, however, requires more. Why? Because relying on one sample-even if it’s a real-world record-doesn’t usually pass the smell test. What’s the problem? Your upbeat test results could be a random outcome. The future’s uncertain no matter how rigorous your research, but a Monte Carlo simulation is well suited for developing a higher level of confidence that a given strategy’s record isn’t a spurious byproduct of chance. This is a critical issue for short-term traders, of course, but it’s also relevant for portfolios with medium- and even long-term horizons. The increased focus on risk management in the wake of the 2008 financial crisis has convinced a broader segment of investors and financial advisors to embrace a variety of tactical overlays. In turn, it’s important to look beyond a single path in history. Research such as Meb Faber’s influential paper “A Quantitative Approach to Tactical Asset Allocation” and scores of like-minded studies have convinced former buy-and-holders to add relatively nimble risk-management overlays to the toolkit of portfolio management. The results may or may not be satisfactory, depending on any number of details. But to the extent that you’re looking to history for guidance, as you should, it’s essential to look beyond a single run of data in the art/science of deciding if a strategy is the genuine article. The problem, of course, is that the real-world history of markets and investment funds is limited-particularly with ETFs, most of which arrived within the past ten to 15 years. We can’t change this obstacle, but we can soften its capacity for misleading us by running alternative scenarios via Monte Carlo simulations. The results may or may not change your view of a particular strategy. But if the stakes are high, which is usually the case with portfolio management, why wouldn’t you go the extra mile? The major hazard of ignoring this facet of analysis leaves you vulnerable. At the very least, it’s valuable to have additional support for thinking that a given technique is the real deal. But sometimes, Monte Carlo simulations can avert a crisis by steering you away from a strategy that appears productive but in fact is anything but. As one simple example, imagine that you’re reviewing the merits of a 50-day/100-day moving average crossover strategy with a one-year rolling-return filter. This is a fairly basic set-up for monitoring risk and/or exploiting the momentum effect, and it’s shown encouraging results in some instances-applying it to the ten major US equity sectors, for instance. Let’s say that you’ve analyzed the strategy’s history via the SPDR sector ETFs and you like what you see. But here’s the problem: the ETFs have a relatively short history overall… not much more than 10 years’ worth of data. You could look to the underlying indexes for a longer run of history, but here too you’ll run up against a standard hitch: the results reflect a single run of history. Monte Carlo simulations offer a partial solution. Two applications I like to use: 1) resampling the existing history by way or reordering the sequence of returns; and 2) creating synthetic data sets with specific return and risk characteristics that approximate the real-world funds that will be used in the strategy. In both cases, I take the alternative risk/return histories and run the numbers through the Monte Carlo grinder. Using R to generate the analysis offers the opportunity to re-run tens of thousands of alternative histories. This is a powerful methodology for stress-testing a strategy. Granted, there are no guarantees, but deploying a Monte Carlo-based analysis in this way offers a deeper look at a strategy’s possible outcomes. It’s the equivalent of exploring how the strategy might have performed over hundreds of years during a spectrum of market conditions. As a quick example, let’s consider how a 10-asset portfolio stacks up in 100 runs based on normally distributed returns over a simulated 20-year period of daily results. If this was a true test, I’d generate tens of thousands of runs, but for now let’s keep it simple so that we have some pretty eye candy to look at to illustrate the concept. The chart below reflects 100 random results for a strategy over 5040 days (20 years) based on the following rules: go long when the 50-day exponential moving average (NYSEMKT: EMA ) is above the 100-day EMA and the trailing one-year return is positive. If either one of those conditions doesn’t apply, the position is neutral, in which case the previous buy or sell signal applies. If both conditions are negative (i.e., 50-day EMA below 100 day and one-year return is negative), then the position is sold and the assets are placed in cash, with zero return until a new buy signal is triggered. Note that each line reflects applying these rules to a 10-asset strategy and so we’re looking at one hundred different aggregated portfolio outcomes (all with starting values of 100). The initial results look encouraging, in part because the median return is moderately positive (+22%) over the sample period and the interquartile performance ranges from roughly +10% to +39%. The worst performance is a loss of a bit more than 7%. The question, of course, is how this compares with a relevant benchmark? Also, we could (and probably should) run the simulations with various non-normal distributions to consider how fat-tail risk influences the results. In fact, the testing outlined above is only the first step if this was a true analytical project. The larger point is that it’s practical and prudent to look beyond the historical record for testing strategies. The case for doing so is strong for both short-term trading tactics and longer-term investment strategies. Indeed, the ability to review the statistical equivalent of hundreds of years of market outcomes, as opposed to a decade or two, is a powerful tool. The one-sample run of history is an obvious starting point, but there’s no reason why it should have the last word.
Risk Factors Drive Lazard’s Systematic Approach To Core Investing

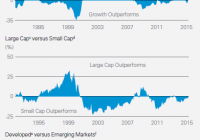
By DailyAlts Staff Core investments are those that anchor the portfolio. Typically, investors pursue exposure to broad-market benchmarks, such as S&P 500 or MSCI indexes for stocks, and the Barclays Aggregate Index for bonds, as part of their core holdings, with the intent of minimizing the unexpected. But rather than passively investing in index funds, Lazard (NYSE: LAZ ) thinks investors should take a systematic approach to implementing core investing strategies, and that is the subject of the firm’s latest Investment Focus white paper: Core Advantage: The Case for a Systematic Approach to Core Investing . The Non-Systematic Approach Managers pursuing non-systematic approaches to providing core exposure suffer from several pitfalls, first among which is the tendency for them to introduce unwanted risks to a portfolio in pursuit of benchmark-beating returns. This can happen from overweighting stocks according to style, market cap, or geographic region. While it might prove rewarding under certain market environments, it can result in outsized losses when trends unexpectedly reverse, and this is not what most investors are looking for from their core holdings. The image below shows how market favor has vacillated over time, shifting between growth and value stocks; large caps and small; and developed and emerging markets: The Systematic Approach The authors of Lazard’s paper believe the systematic approach is the best for core investing, because it allows managers to maintain stricter parameters relative to their benchmark, by ensuring against concentration according to market cap, sector, or country. Additionally, using a rules-based, data-driven, and systematic approach allows managers to analyze hundreds, even thousands of stocks within a given universe, in real-time using a bottom-up process; and to combine “robust risk management” with stock selection. How does it work? Well, according to Lazard, various risk factors have been rewarded by markets over time, including valuation, sentiment, and quality, as depicted in the image below: Valuation compares a company’s price to its peers and its own historical record, and favors companies that are inexpensive and offer long-term value. It’s a contrarian approach, and investors need to be prepared to endure short-term, unrealized losses. Sentiment is gauged by looking at the stock’s price strength, relative to the other stocks in its sector and broader benchmark, as well as analyst upgrades. In Lazard’s approach, liquidity is also taken into account by looking at volume-weighted momentum, and companies with strengthening momentum are favored while those with weakening momentum are disfavored. Quality is assessed by stability of returns and low earnings-volatility. According to Lazard, quality stocks are often those in the process of “migrating” from the realm of growth stocks to that of value. Systematic Evolution Systematic investing avoids concentrating investments in any one area and seeks to maintain a composition similar to that of its benchmark. This requires what Lazard calls an “evolving approach,” wherein investment professionals are constantly researching and testing potential improvements to the investment process. Lazard’s own approach, as implemented by the Lazard Equity Advantage team, is “uniquely positioned to help clients achieve their investment goals,” according to Lazard. “This has proved to be a solid foundation on which to build equity asset class exposure – especially through core approaches – and long-term investment program success.” For more information, download a pdf copy of the white paper .

The Joy Of Portfolio Boredom

The word boring is worth exploring further as it is a very important building block of long-term investment success. Getting rich slowly or maybe the more modest goal of getting financially comfortable slowly means some pretty plain vanilla portfolio construction. The more exciting a portfolio is on the way up, the more “exciting’ it will be on the way down. Last week I stumbled across an article that favorably critiqued an alternative-strategy ETF for being boring which is its objective. “Boring” is not the stated objective in the prospectus but terms like market neutral, absolute return, low correlation to equities and some others really are about boredom. You can judge for yourself whether a given fund that is supposed to be boring is indeed boring, as not every fund will deliver on its stated objective. The word boring is worth exploring further as it is a very important building block of long-term investment success. Ten years ago I wrote a post called Getting Rich Slowly and while I have no idea whether the phrase was a Random Roger original, I think it captures the path that most people want to take in terms of realistic participation in capital markets. Getting rich slowly, or maybe the more modest goal of getting financially comfortable slowly, means some pretty plain vanilla portfolio construction. How you get to plain vanilla probably depends on the level of engagement you want to have in markets but from the top down it should start with blending together things like equities, fixed income and a small slice to alternatives (what for years I’ve been referring to as diversifiers) with relatively simple products and/or individual issues in such a way where all three sleeves avoid trading in lockstep, but over a long period of time gives a chance for having enough money when you need it, which presumably is at retirement. As we have discussed many times before, one of the biggest impediments to long-term financial success is succumbing to emotion at the worst possible times, which can mean panic selling your portfolio at a low or repeatedly panic buying hot stocks at their highs after a pundit just extrapolated past returns on stock market television. I had the opportunity to moderate a panel that included Dr. Richard Thaler about behavioral economics/finance, and one thing he talked about as a very common bias is loss aversion, which basically means that pound for pound people feel losses far more than they feel gains. Take that out a little further and it explains why people often react to large declines like they’ve never happened before; the tendency to think this one is different. The more exciting a portfolio is on the way up, the more “exciting’ it will be on the way down. Investors of course don’t mind excitement when it is resulting in gains, but the longer it goes on, the more complacent they become in terms of forgetting the last decline or using hindsight bias to explain away the last decline. Investors don’t want boring until the market peaks out, which of course is plenty guessable but not knowable. If there is no way to know when the market will peak and losses trigger twice the emotion that gains do, then right there is the argument for boring all of the time. Again, the context for boring is not no equities but if you can buy into the idea that an adequate savings rate, proper asset allocation and not panicking are the most important determinants to long-term portfolio success then the focus shifts more in line with the true long-term objective. You are very unlikely to remember what your portfolio did in the 3rd quarter of 2013 or what the market did that quarter, without looking, because it doesn’t matter in the context of your long-term financial plan. An exception would be if that was the quarter you retired. The only other way some random calendar quarter from your past is likely to matter is if you made some sort of catastrophic mistake like selling out in the first quarter of 2009. The conclusion for me is a diversified portfolio of equities that at the very least offers decent upside participation, fixed income exposure that offers some ballast to normal equity volatility and a little exposure to diversifiers, as I said above, that hopefully allows for managing volatility and correlation such that the potential for panic is at least partially mitigated. Disclosure: I/we have no positions in any stocks mentioned, and no plans to initiate any positions within the next 72 hours. (More…) I wrote this article myself, and it expresses my own opinions. I am not receiving compensation for it. I have no business relationship with any company whose stock is mentioned in this article. Additional disclosure: To the extent that this content includes references to securities, those references do not constitute an offer or solicitation to buy, sell or hold such security. AdvisorShares is a sponsor of actively managed exchange-traded funds (ETFs) and holds positions in all of its ETFs. This document should not be considered investment advice and the information contain within should not be relied upon in assessing whether or not to invest in any products mentioned. Investment in securities carries a high degree of risk which may result in investors losing all of their invested capital. Please keep in mind that a company’s past financial performance, including the performance of its share price, does not guarantee future results. To learn more about the risks with actively managed ETFs visit our website AdvisorShares.com .