Unitil Corp.: Small And Dull Isn’t Necessarily A Bad Thing
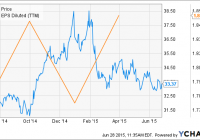
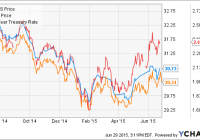
Summary Electricity and natural gas distributor Unitil Corp. has seen its share price fall by 13% YTD even as its earnings were boosted by frigid winter conditions in its service area. The company has an impressive record, with its share price outperforming between FY 2010 and FY 2014 and strong net income and EPS CAGRs over the same period. A lack of market penetration in its service area and investments in expanded natural gas capacity should enable the company to continue its earnings growth trend in coming years. Its shares are not undervalued at present, although bearish sentiment from a rising interest rate could create an attractive long investment opportunity. Existing investors are encouraged to maintain their positions while potential investors are encouraged to initiate long positions if the share price falls below $30.40 in response to interest rate news. Electricity and natural gas distributor Unitil Corp. (NYSE: UTL ) has seen its share price and trailing diluted EPS move in opposite directions over the last several months, with the former falling by 13% since late February even as the company’s earnings were boosted by a harsh Northeast winter (see figure). The company has been an above-average performer on the S&P Utility Index since the beginning of FY 2010 and hasn’t reduced its dividend since its incorporation in 1984. This track record has not been enough to shield Unitil from the bearish sentiment that has afflicted the utility sector in anticipation of rising interest rates later this year, however. This article considers Unitil as a potential long investment in light of its falling share price and strong earnings YTD. UTL data by YCharts Unitil Corp. at a glance Unitil is a New Hampshire-based utility public holding company that provides electricity to 102,400 customers and natural gas to 75,900 customers in the states of New Hampshire, Massachusetts, and Maine. The company serves its customers via its five wholly-owned subsidiaries. Unitil Energy Systems is an electric distribution utility serving 74,000 customers in central New Hampshire, including Concord. Fitchburg Gas and Electric Light distributes electricity to 15,700 natural gas customers and 28,600 electricity customers in northern Massachusetts. Northern Utilities is a natural gas distribution utility with 62,200 customers in coastal New Hampshire and Maine, while Granite State Gas Transmission owns and operates an 86-mile underground natural gas pipeline that runs throughout Unitil’s subsidiary natural gas service areas in New Hampshire and Maine. While these subsidiary utilities are all regulated, Unitil also owns Usource LLC, which is an unregulated energy brokering and management firm that serves as agent for 1,200 customers. Unitil has been one of the better performers in the utility sector, with its shares outperforming both the S&P 500 and the S&P Utility Index between the beginning of FY 2010 and end of FY 2014 even as it has been largely ignored by analysts (only one analyst participated in its most recent earnings call ). This performance can be attributed to several factors, including access to inexpensive debt that has allowed it to finance a 54% increase in its net PP&E value, a favorable regulatory structure that has allowed it to report consecutive increases to ROE since FY 2012, and low customer penetration within its existing natural gas distribution system. The company has also benefited from its exposure to natural gas distribution, which has grown steadily since the end of 2011 (see figure) as increased shale gas extraction caused prices to plummet. This has been a boon to natural gas distributors in the form of rising sales volumes and revenues. Unitil has experienced CAGRs of 17% and 12% for its net income and diluted EPS, respectively, since FY 2012. Meanwhile, natural gas distribution now generates 55% of the company’s sales margin versus 45% for electricity (as of FY 2014). US Natural Gas Consumption data by YCharts Q1 earnings report Unitil reported very strong Q1 earnings at the end of April in the wake of an especially cold and snowy winter in the Northeast U.S. Consolidated revenue came in at $172.2 million, up 10.3% from $156.1 million YoY and beating the consensus estimate by 7.8% (see table). Natural gas revenue increased by 8.3% over the previous year’s Q1 to $100.3 million while electricity revenue increased by 13.6% to $70.3 million. The only subsidiary to report flat revenue was Usource, where revenue remained unchanged at $1.6 million. The revenue gains were driven by strong natural gas sales, which increased by 6.8% YoY; electric sales gained only slightly to 0.3%. The former’s strong performance was the result of a combination of the cold weather, with Q1 containing 4% more heating days versus the previous year and 14% more versus the long-term average, and FY 2014’s 3% increase in total customers. Unitil Corp. Financials (non-adjusted) Q1 2015 Q4 2014 Q3 2014 Q2 2014 Q1 2014 Revenue ($MM) 172.2 119.8 76.6 73.3 156.1 Gross income ($MM) 61.6 50.7 39.3 36.6 57.3 Net income ($MM) 13.6 9.4 1.6 1.1 12.6 Diluted EPS ($) 0.98 0.68 0.11 0.08 0.91 EBITDA ($MM) 39.8 31.3 18.5 17.4 35.8 Source: Morningsta r (2015). Gross income rose by 7.5% YoY due to a 6.3% increase to the consolidated natural gas sales margin and a 10.4% increase to the consolidated electricity sales margin. The distribution of the sales margin between natural gas and electricity remained almost unchanged from the previous Q1 at 63% and 37%, respectively (residential and commercial natural gas consumption peaks in the winter when heaters are running whereas electricity consumption is higher in the summer when air conditioners are in use, explaining the difference between the Q1 distribution and the FY 2014 distribution). These increases caused net income to improve by 8% YoY to $13.6 million from $12.6 million, resulting in a diluted EPS of $0.98 versus $0.91 YoY that beat the analyst consensus by $0.04. EBITDA rose to $39.8 million from $35.8 million the previous year. The EPS improvement and beat were both largely attributable to the winter weather, with management stating in the Q1 earnings call that the higher number of heating degree days boosted EPS by $0.02 compared to the previous year and $0.08 compared to the long-term average in the service area. The weather was not the only positive factor, however, as natural gas therm sales increased by 5% YoY on a weather-normalized basis due to a combination of more customers and the rapid fall in the price of natural gas that occurred in the second half of 2014. The impressive earnings performance brought Unitil’s trailing ROE up to 9.2% overall, compared to 8% and 8.2% in FY 2012 and FY 2013, respectively. Unitil ended the quarter with $11.2 million in cash, down from $14.3 million the previous year (see table) due to infrastructure investments over the previous four quarters. The company’s current ratio improved YoY from 1.11 to 1.28 despite this cash decrease, however, while its total assets grew by 12% thanks to an 11% increase to net PP&E compared to Q1 2014. While Unitil’s balance sheet isn’t as strong as some other utilities, in combination with the company’s earnings growth record it is sufficient to maintain a BBB+ credit rating from S&P. Furthermore, while cash on hand is not substantial, it is augmented by $88 million remaining in credit facility liquidity. Management was comfortable enough with the state of the company’s finances at the end of FY 2015 to increase the quarterly dividend by 1.4%, resulting in a forward yield of 4.2% based on an annual dividend of $1.40. While not as high as some of the bigger utility names – the widely-followed utility Southern Company (NYSE: SO ) has a forward yield of 5.2% at present – it is higher than the sector average. The iShares U.S. Utilities ETF (NYSEARCA: IDU ) has a 3.57% yield before expenses, for example. Unitil Corp. Balance Sheet (restated) Q1 2015 Q4 2014 Q3 2014 Q2 2014 Q1 2014 Total cash ($MM) 11.2 8.4 10.1 12.0 14.3 Total assets ($MM) 1,040.8 1,000.2 916.5 900.6 928.0 Current liabilities ($MM) 140.4 129.4 76.0 102.6 131.7 Total liabilities ($MM) 757.5 726.9 648.6 629.8 654.0 Source: Morningstar (2015). Outlook Unitil offers potential investors with a number of advantages over other utilities in addition to its high dividend yield. First, the company only has 60% penetration within its existing natural gas distribution system, leaving it with 50,000 potential future customers without the need for investment into expanded service areas. This gap allowed it to achieve a customer growth rate in FY 2014 that was 3x the region average. Furthermore, roughly 70% of the company’s existing natural gas distribution system is made of new, high-durability materials, minimizing the amount of capex that needs to be directed toward the replacement of existing capacity. Unitil therefore has the ability to generate continued earnings growth in coming years via existing capacity, supporting a continuation of its net income CAGR of 17%. Unitil is in the process of expanding its service areas to meet expected natural gas demand in the Northeast U.S. despite its ability to meet new customer growth with its current capacity. Northern Utilities is in the process of expanding its natural gas service areas to increase the company’s potential customer growth in coming quarters. Electricity isn’t being ignored either, with a sufficient number of new substations being constructed in New Hampshire to meet expected load growth in the state. There are a number of reasons to expect natural gas and electricity demand to increase in Unitil’s service area. First, the regional economy has fared quite well of late, with the unemployment rates in New Hampshire, Massachusetts, and Maine all falling well below the U.S. average (see figure). This trend, combined with the continued presence of inexpensive natural gas prices, will eliminate constraints on natural gas consumption. Finally, all three states benefit from their reliance on relatively clean feedstocks for electricity generation compared to other states. Coal as a source of electricity has come under a great deal of pressure from state and federal regulators in recent months. That fuel is responsible for only a small fraction of the electricity produced in Unitil’s service area, however, with nuclear power, natural gas, and renewables generating the vast majority of electricity there. Coal’s regulatory difficulties have boosted the fortunes of natural gas and will benefit those companies such as Unitil that generate income by distributing the latter. New Hampshire Unemployment Rate data by YCharts Valuation Analyst estimates for Unitil’s diluted EPS in FY 2015 and FY 2016 have remained quite stable over the last 90 days, reflecting the lack of volatility in the company’s outlook. The consensus estimate for FY 2015 has remained unchanged at $1.90 while that for FY 2016 has fallen only slightly from $2.00 to $1.98. While the presence of only two analyst estimates would normally call these numbers into question, the performance stability of regulated entities suggests that they will be close to the company’s actual results. If so, they will represent the company’s best earnings since at least FY 2010, continuing a growth trend that has been in place since that year. Unitil’s share price at the time of writing of $33.37 yields a trailing P/E ratio of 17.9x and forward ratios for FY 2015 and FY 2016 of 17.5x and 16.9x, respectively (see figure). All three of these numbers are solidly in the middle of their respective ranges since the beginning of 2012, suggesting that the firm’s shares are fairly valued at present. UTL PE Ratio (NYSE: TTM ) data by YCharts Conclusion Unitil Corp. has been something of an unsung hero among public regulated utilities over the last five years, outperforming both its sector and the broader market since the beginning of FY 2010 even as it has gone largely unnoticed by analysts. Both of these developments can be attributed in large part to the company’s focus on a small service area in a relatively rural part of the country. This lack of size and volatility shouldn’t deter investors, however, as the company’s recent track record has demonstrated. While I believe that Unitil is in a position to continue its record of steady earnings and dividend growth by increasing its market penetration within its existing service area and expanding its natural gas service area, the lack of a clear value argument at present and the prospect of bearish sentiment continuing to negatively impact utilities’ share prices as the first interest rate increase by the Federal Reserve in almost a decade grows closer prevent me from initiating a long investment at this time. Existing investors should hold their positions, however, and I will look to join them in the event that the company’s FY 2015 P/E ratio falls below 16x (or $30.40 based on the current consensus estimate). Disclosure: I/we have no positions in any stocks mentioned, but may initiate a long position in UTL over the next 72 hours. (More…) I wrote this article myself, and it expresses my own opinions. I am not receiving compensation for it (other than from Seeking Alpha). I have no business relationship with any company whose stock is mentioned in this article.