Tag Archives: transactionname

Caution Needed In The Current Volatility Market

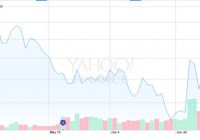
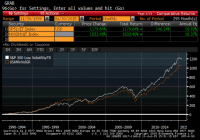
Summary The Greek/Chinese event didn’t even come close to causing a market freakout. We need bigger and better freakouts for the most profitable results. Freakout! Queue “Le Freak” by Chic. This article will focus on historical levels of contango and backwardation and how that can guide your volatility investments. Even though it was a point of contention with some of my readers, we saw a swift and sudden drop off in volatility, just as I predicted. Why? China and Greece. Two very different countries with very different problems. China: China is hunting for market manipulators while banning short selling of stocks and selling in general. Who is manipulating whom over there? Eventually fundamentals will begin to rule the Chinese market, but it will trade at a discount for some time based on a lack of trust from global investors. Greece: Speaking of trust, the Eurozone ran out of it for Greece. After agreeing to a deal that was worse than the one it rejected, Greece is now begging to stay part of the family. I was sure we would get more drama out of this one, but for now fears have subsided. Still a volatility wildcard in the short-term. The continuing question I have on Greece is, what was resolved? Nothing is set in stone yet and you have the IMF stating that the current deal will never work. I personally think the best thing for Greece and the Greek people would be to return to their own currency. Just my two cents. UVXY The ProShares Ultra VIX Short-Term Futures ETF (NYSEARCA: UVXY ) had quite a run over the past few weeks. We will take a look at the chart below after reviewing what drives UVXY (regular readers can skip to the chart). UVXY profits from increasing VIX futures. By investing in second month contracts, usually priced at a premium known as contango, it hopes they will increase in value before being sold off to roll into the new second month. Backwardation is when second month futures are priced higher than from month futures. This benefits UVXY and reverses the usual time value decay caused by contango. For more on contango and backwardation, click here . (click to enlarge) As we spoke about before, UVXY benefits from backwardation. See below for the contango/backwardation in the VIX futures over the past few weeks. (click to enlarge) The VIX futures reached 1.36% into backwardation (higher in intraday) and receded into backwardation several times (again during intraday). Warning If you have been a regular reader of mine you know my strategy is cut and dry. Always avoid trying to catch a spike up in volatility. Wait until VIX futures spike and then initiate a short position. During the next year, you need to be very careful about when to short volatility. As previously pointed out, some writers on Seeking Alpha were screaming “short volatility” the second it spiked after the Greek news came out. This is purely bad advice. Sure you may win some battles, but you will lose the war. Not all spikes in volatility are created equal which is why there isn’t a science that works 100% of the time when investing in volatility. My point is, eventually and I believe in the next year, a market pullback will turn into a correction. Right now the U.S. is a safe haven because things are more risky around the globe. Are you going to go all in shorting volatility 3% into a possible correction? I would hope not. Telling signs The phrase “it will get better” doesn’t always apply to the stock market in the short-term (which is what you should be focused on with volatility). The market has bred a new class of investor that believes every pullback will be followed by a subsequent recovery and market rally. This is simply not true. Advice The contango and backwardation indicators are one of the best resources to use for when to short volatility. The other is your brain. See below: (click to enlarge) I created this chart myself using historical data from The Intelligent Investor Blog . Dates are not included in the chart due to some issues I am having with Excel and axis placements. The chart begins in 2004 and runs to present in 2015. When removing 2008 the normal contango and backwardation events would look like the ones below: (click to enlarge) I have added wording to the chart which describes my personal opinion on events and the level of backwardation they would warrant. Depending on the level of a recession you would most likely see backwardation in excess of 25%. In this period of ultra low volatility I would expect a correction to possibly produce a backwardation event in the 20% range. Conclusion My point in these charts are that 1.36% backwardation should not cause you to go “all in” on volatility, ever. You could bet more when the economy is great, but I would not use that word to describe the current state of the economy. I need much healthier and organic growth to feel rosy about the U.S. economy. UVXY Call Spread (Options) I have posted a call spread strategy to my blog which you can view here . UVXY Recommendation The shorting opportunity for UVXY has passed. I never recommend purchasing or holding UVXY to bet on rising volatility. For more information on my strategy of only shorting volatility, please view my past articles. Patience is key and greed will eventually destroy you with volatility. Now is again a time to be patient and wait for another spike in the VIX. Keep an eye on the backwardation meter to judge the proper timing. Wait until things feel like they can’t get much worse, then wait some more. Thanks for reading and I hope you have a profitable week! Disclosure: I/we have no positions in any stocks mentioned, and no plans to initiate any positions within the next 72 hours. (More…) I wrote this article myself, and it expresses my own opinions. I am not receiving compensation for it (other than from Seeking Alpha). I have no business relationship with any company whose stock is mentioned in this article.

The Low Volatility Debate: SPLV Vs. USMV

Summary The Low Volatility Anomaly describes portfolios of lower volatility securities that have produced higher risk-adjusted returns than higher volatility securities historically. Two ETFs – SPLV and USMV – have amassed $5B apiece in assets under management seeking to capitalize on this anomaly. This article discusses the relative differences in how these funds are constructed and how these discrepancies can impact their respective risk-return profiles. I recently reprised my series on five buy-and-hold strategies that have historically produced better absolute and risk-adjusted returns than the broader market. The third of these five strategies was about the Low Volatility Anomaly, or why lower risk stocks have historically outperformed their higher risk counterparts. A reader in the comments section of the article asked why I preferred the Powershares S&P 500 Low Volatility ETF (NYSEARCA: SPLV ) over the iShares MSCI USA Minimum Volatility ETF (NYSEARCA: USMV ). Given the increasing popularity of low volatility strategies, I thought that this would make an excellent topic for Seeking Alpha Readers. (For readers looking for a primer on Low Volatility Strategies prior to delving into a review of the top two domestic fund choices, please reference the links in the article or read Making Buffett’s Alpha Your Own .) What are the differences in the strategies? Given that these are both passive funds seeking to replicate the returns of an index, the answer to this question will be driven by the differences between the two benchmarks. SPLV seeks to replicate the S&P 500 Low Volatility Index, which is constituted by the one-hundred least volatile stocks in the S&P 500 (NYSEARCA: SPY ) as measured by the standard deviation of the security’s daily price returns over the trailing year and rebalanced quarterly. In contrast, the MSCI USA Minimum Volatility Index is calculated by optimizing its parent index the MSCI USA Index for the lowest absolute risk subject to constraints to maintain replicability, investability, and to limit turnover and industry concentrations. What have the risk and return profiles of these indices been historically? Below is a cumulative return series of the two indices since the earliest dually available data points. You can see that the S&P Low Volatility Index has outperformed by 55bp per annum. (click to enlarge) Drilling down further into these index return series, I have tabled some summary risk and return statistics for the return profiles of these two indices. In addition to higher cumulative returns over the matched sample period, the S&P 500 Low Volatility Index had lower variability of returns and a smaller peak-to-trough drawdown. The underlying indices are of course uninvestable, with the exchange-traded funds seeking to replicate these index returns the best way for retail investors to follow these strategies. Respectively, the ETF tracking these indices have only been outstanding since May and October 2011. It is difficult to determine the efficacy of either strategy in a market characterized by such strong returns over the short life span of these funds. I have graphed the cumulative returns of these ETFs since USMV’s later inception below: (click to enlarge) While the index data is necessarily backcasted, I believe that the longer time series for the indices, which featured three economic recessions and two large stock market drawdowns, is more informative than the history of the exchange-traded funds, which have existed only during a historic bull market. I hope that this analysis is valuable to Seeking Alpha readers interested in low volatility strategies but who might not have access to the historical return data. How does the composition of these two funds differ today? Despite the very strong correlation noted in the historical return series above, the composition of the two indices is quite unique. I examined the industry concentrations, top holdings, and index fundamentals in this section. Industry Concentrations The MSCI USA Minimum Volatility Index constraint to keep sector weightings within 5% of the market-weighted index gives it a more diversified set of industry exposures than the S&P Low Volatility Index, which is industry agnostic and formed from the one-hundred stocks in the S&P 500 with the lowest realized volatility. Readers likely share my surprise that financials dominate the Low Volatility Index. Also of note, utilities, traditionally a defensive, low beta industry, are under-represented. When I wrote about Low Volatility Stocks in mid-2013 , utilities represented more than a quarter of the Low Volatility index. You can bet that the Low Volatility Index was relatively underweight financials prior to the financial crisis as rising return volatility would have seen these stocks excluded from the portfolio. An industry-agnostic tilt towards lower volatility stocks is likely what caused the relative outperformance of the Low Volatility Index relative to the Minimum Volatility Index through the stock market slump in 2008- early 2009. Top Holdings There is some decided overlap between the top holdings, but the interesting part of this chart is less about how they are similar but rather how they are different. Despite the USMV index having 64% more holdings (164 vs. 100), it is still slightly more concentrated in its top holdings. Because the index weights of SPLV are the inverse of their trailing one-year volatilities rebalanced quarterly, the fund is much more close to equal-weighted because stock volatilities are likely to be less divergent than a capitalization-weighting. Like low volatility strategies, equal weighting is also one of my five factor tilts that have historically produced higher risk-adjusted returns than the market . Readers should also note that Exxon Mobil (NYSE: XOM ) is in the top ten holdings of USMV whereas no Energy stocks are included in the one-hundred constituents in the S&P Low Volatility Index. Falling oil prices have led to more volatile returns in that space, excluding those stocks from the Low Volatility Index. USMV is required to maintain an Energy exposure to keep the index from deviating outside of its industry band with the parent index. Exxon and its fortress balance sheet represent a whopping 48% of the Energy sector weight for USMV. Index Fundamentals The average index fundamentals are relatively similar. Lower volatility stocks currently trade at incrementally higher multiples than the market, and their more steady business profiles lend to higher dividend yields. Multiples throughout the market are stretched, and investors should be asking whether the premium multiple in low volatility stocks is attractive given their higher downside protection. Some might counter that it is a valuable feature while others might contend that this downside protection is now priced too expensively. I remain in the former camp. As I wrote in my 10 Themes Shaping Markets in the Back Half of 2015 : “Stretched equity multiples domestically will necessitate that valuations be driven by changes in earnings, tempering further price gains. As equity prices rise, investors may look to opportunistically rotate into underperforming rate-sensitive assets and lower volatility assets.” Conclusion For me, the S&P Low Volatility Index’s construction is a simple and transparent way to access a low volatility bent. I am not seeking to minimize volatility, but generate higher risk-adjusted returns, which the S&P Low Volatility Index has done historically versus both the broader market and the MSCI USA Minimum Volatility Index. There are certainly cases to be made for USMV. The replicating ETF is lower cost (15bp to SPLV’s 25bp), and has more constituents and less industry concentration. This greater diversification has not led to lower risk however in the historical study. You want to be incrementally overweight more defensive industries as markets are correcting. In a great 2011 paper, ” Benchmarks as Limits to Arbitrage: Understanding the Low Volatility Anomaly “, the authors concluded that behavioral biases towards high volatility stocks coupled with delegated investment management with fixed benchmarks without the use of leverage flattens the relationship between risk and return. If benchmarking is an impediment to capturing the Low Volatility Anomaly, why would I want my Low Volatility fund exposure to have more rigid industry constraints. Since the S&P Low Volatility Index is less constrained, its industry concentrations can swing meaningfully. I discussed previously the sharp reduction in utility exposure, which has likely been a function of that sector’s greater interest rate sensitivity and a pickup in interest rate volatility. Investors may look at the current higher allocation of utilities in USMV or lower allocation to financials and determine that industry mix is preferable to them. In analyzing the funds in this manner, they can be viewed more as complements than substitutes. Both of these funds have their merits, and I applaud the fund families’ efforts to provide low-cost solutions to retail investors seeking to capture the Low Volatility Anomaly. Hopefully, readers now better understand the differences in index construction and how that manifests into different risk-return profiles Author’s Postscript As an aside, this article was prompted by reader feedback. Intelligent discussion and debate is what transitions Seeking Alpha from a collection of articles into a community. Please share your thoughtful observations that you believe could further this research as we all try to “Seek Alpha” together. Disclaimer My articles may contain statements and projections that are forward-looking in nature, and therefore inherently subject to numerous risks, uncertainties and assumptions. While my articles focus on generating long-term risk-adjusted returns, investment decisions necessarily involve the risk of loss of principal. Individual investor circumstances vary significantly, and information gleaned from my articles should be applied to your own unique investment situation, objectives, risk tolerance, and investment horizon. Disclosure: I am/we are long SPLV, SPY. (More…) I wrote this article myself, and it expresses my own opinions. I am not receiving compensation for it (other than from Seeking Alpha). I have no business relationship with any company whose stock is mentioned in this article.

Tough Times For Broadly Diversified Portfolios

How’s your globally diversified strategy faring these days? Having a tough time? You’re not alone – the headwinds are fierce. For the first time in recent memory, the overwhelming majority of the major asset classes are in the red on a trailing one-year basis. As a result, broadly defined asset allocation strategies are suffering, at least relative to the stellar numbers in recent years. Using a set of ETF proxies for the trailing 250-day (1 year) total return, only US stocks, US REITs (real estate investment trusts), and US bonds (broadly defined) are posting gains among the major asset classes. By contrast, the other 11 asset classes are in varying states of loss over that period. Here’s another view by indexing all the ETFs to 100 as of July 16, 2014… ouch! (click to enlarge) Given the current environment, it’s no surprise that a broadly defined asset class strategy has stumbled lately. For instance, consider an ETF-based version of an unmanaged, market value weighted mix of all the major asset classes – the Global Market Index Fund, or GMI.F, which holds all the ETFs in the table above. Here’s how GMI.F stacks up for the past 250 trading days through yesterday (July 14, 2015). This investable strategy is ahead by less than 1% over that span – below the performance for US stocks (NYSEARCA: VTI ) and US bonds (NYSEARCA: BND ). (click to enlarge) Is GMI’s diminished performance surprising? Maybe, but only if you weren’t paying attention. Risk premia projections for GMI have been relatively soft for some time ( see this month’s update, for instance) – after several years of hefty gains for GMI and equivalent strategies. The lesson, of course, is that mean reversion is alive and well when it comes to market (and portfolio strategy) returns. Share this article with a colleague