Scalper1 News
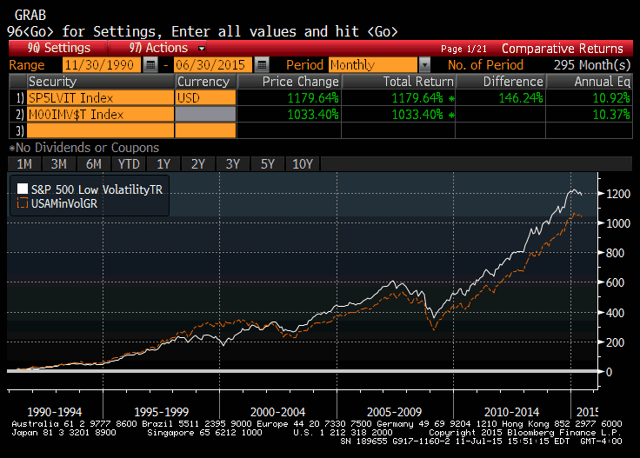
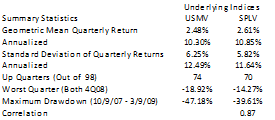
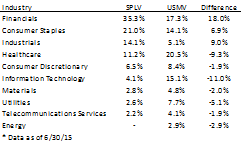
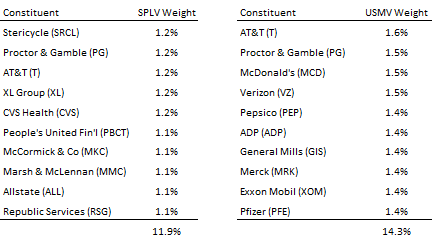
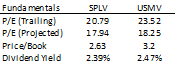 Summary The Low Volatility Anomaly describes portfolios of lower volatility securities that have produced higher risk-adjusted returns than higher volatility securities historically. Two ETFs – SPLV and USMV – have amassed $5B apiece in assets under management seeking to capitalize on this anomaly. This article discusses the relative differences in how these funds are constructed and how these discrepancies can impact their respective risk-return profiles. I recently reprised my series on five buy-and-hold strategies that have historically produced better absolute and risk-adjusted returns than the broader market. The third of these five strategies was about the Low Volatility Anomaly, or why lower risk stocks have historically outperformed their higher risk counterparts. A reader in the comments section of the article asked why I preferred the Powershares S&P 500 Low Volatility ETF (NYSEARCA: SPLV ) over the iShares MSCI USA Minimum Volatility ETF (NYSEARCA: USMV ). Given the increasing popularity of low volatility strategies, I thought that this would make an excellent topic for Seeking Alpha Readers. (For readers looking for a primer on Low Volatility Strategies prior to delving into a review of the top two domestic fund choices, please reference the links in the article or read Making Buffett’s Alpha Your Own .) What are the differences in the strategies? Given that these are both passive funds seeking to replicate the returns of an index, the answer to this question will be driven by the differences between the two benchmarks. SPLV seeks to replicate the S&P 500 Low Volatility Index, which is constituted by the one-hundred least volatile stocks in the S&P 500 (NYSEARCA: SPY ) as measured by the standard deviation of the security’s daily price returns over the trailing year and rebalanced quarterly. In contrast, the MSCI USA Minimum Volatility Index is calculated by optimizing its parent index the MSCI USA Index for the lowest absolute risk subject to constraints to maintain replicability, investability, and to limit turnover and industry concentrations. What have the risk and return profiles of these indices been historically? Below is a cumulative return series of the two indices since the earliest dually available data points. You can see that the S&P Low Volatility Index has outperformed by 55bp per annum. (click to enlarge) Drilling down further into these index return series, I have tabled some summary risk and return statistics for the return profiles of these two indices. In addition to higher cumulative returns over the matched sample period, the S&P 500 Low Volatility Index had lower variability of returns and a smaller peak-to-trough drawdown. The underlying indices are of course uninvestable, with the exchange-traded funds seeking to replicate these index returns the best way for retail investors to follow these strategies. Respectively, the ETF tracking these indices have only been outstanding since May and October 2011. It is difficult to determine the efficacy of either strategy in a market characterized by such strong returns over the short life span of these funds. I have graphed the cumulative returns of these ETFs since USMV’s later inception below: (click to enlarge) While the index data is necessarily backcasted, I believe that the longer time series for the indices, which featured three economic recessions and two large stock market drawdowns, is more informative than the history of the exchange-traded funds, which have existed only during a historic bull market. I hope that this analysis is valuable to Seeking Alpha readers interested in low volatility strategies but who might not have access to the historical return data. How does the composition of these two funds differ today? Despite the very strong correlation noted in the historical return series above, the composition of the two indices is quite unique. I examined the industry concentrations, top holdings, and index fundamentals in this section. Industry Concentrations The MSCI USA Minimum Volatility Index constraint to keep sector weightings within 5% of the market-weighted index gives it a more diversified set of industry exposures than the S&P Low Volatility Index, which is industry agnostic and formed from the one-hundred stocks in the S&P 500 with the lowest realized volatility. Readers likely share my surprise that financials dominate the Low Volatility Index. Also of note, utilities, traditionally a defensive, low beta industry, are under-represented. When I wrote about Low Volatility Stocks in mid-2013 , utilities represented more than a quarter of the Low Volatility index. You can bet that the Low Volatility Index was relatively underweight financials prior to the financial crisis as rising return volatility would have seen these stocks excluded from the portfolio. An industry-agnostic tilt towards lower volatility stocks is likely what caused the relative outperformance of the Low Volatility Index relative to the Minimum Volatility Index through the stock market slump in 2008- early 2009. Top Holdings There is some decided overlap between the top holdings, but the interesting part of this chart is less about how they are similar but rather how they are different. Despite the USMV index having 64% more holdings (164 vs. 100), it is still slightly more concentrated in its top holdings. Because the index weights of SPLV are the inverse of their trailing one-year volatilities rebalanced quarterly, the fund is much more close to equal-weighted because stock volatilities are likely to be less divergent than a capitalization-weighting. Like low volatility strategies, equal weighting is also one of my five factor tilts that have historically produced higher risk-adjusted returns than the market . Readers should also note that Exxon Mobil (NYSE: XOM ) is in the top ten holdings of USMV whereas no Energy stocks are included in the one-hundred constituents in the S&P Low Volatility Index. Falling oil prices have led to more volatile returns in that space, excluding those stocks from the Low Volatility Index. USMV is required to maintain an Energy exposure to keep the index from deviating outside of its industry band with the parent index. Exxon and its fortress balance sheet represent a whopping 48% of the Energy sector weight for USMV. Index Fundamentals The average index fundamentals are relatively similar. Lower volatility stocks currently trade at incrementally higher multiples than the market, and their more steady business profiles lend to higher dividend yields. Multiples throughout the market are stretched, and investors should be asking whether the premium multiple in low volatility stocks is attractive given their higher downside protection. Some might counter that it is a valuable feature while others might contend that this downside protection is now priced too expensively. I remain in the former camp. As I wrote in my 10 Themes Shaping Markets in the Back Half of 2015 : “Stretched equity multiples domestically will necessitate that valuations be driven by changes in earnings, tempering further price gains. As equity prices rise, investors may look to opportunistically rotate into underperforming rate-sensitive assets and lower volatility assets.” Conclusion For me, the S&P Low Volatility Index’s construction is a simple and transparent way to access a low volatility bent. I am not seeking to minimize volatility, but generate higher risk-adjusted returns, which the S&P Low Volatility Index has done historically versus both the broader market and the MSCI USA Minimum Volatility Index. There are certainly cases to be made for USMV. The replicating ETF is lower cost (15bp to SPLV’s 25bp), and has more constituents and less industry concentration. This greater diversification has not led to lower risk however in the historical study. You want to be incrementally overweight more defensive industries as markets are correcting. In a great 2011 paper, ” Benchmarks as Limits to Arbitrage: Understanding the Low Volatility Anomaly “, the authors concluded that behavioral biases towards high volatility stocks coupled with delegated investment management with fixed benchmarks without the use of leverage flattens the relationship between risk and return. If benchmarking is an impediment to capturing the Low Volatility Anomaly, why would I want my Low Volatility fund exposure to have more rigid industry constraints. Since the S&P Low Volatility Index is less constrained, its industry concentrations can swing meaningfully. I discussed previously the sharp reduction in utility exposure, which has likely been a function of that sector’s greater interest rate sensitivity and a pickup in interest rate volatility. Investors may look at the current higher allocation of utilities in USMV or lower allocation to financials and determine that industry mix is preferable to them. In analyzing the funds in this manner, they can be viewed more as complements than substitutes. Both of these funds have their merits, and I applaud the fund families’ efforts to provide low-cost solutions to retail investors seeking to capture the Low Volatility Anomaly. Hopefully, readers now better understand the differences in index construction and how that manifests into different risk-return profiles Author’s Postscript As an aside, this article was prompted by reader feedback. Intelligent discussion and debate is what transitions Seeking Alpha from a collection of articles into a community. Please share your thoughtful observations that you believe could further this research as we all try to “Seek Alpha” together. Disclaimer My articles may contain statements and projections that are forward-looking in nature, and therefore inherently subject to numerous risks, uncertainties and assumptions. While my articles focus on generating long-term risk-adjusted returns, investment decisions necessarily involve the risk of loss of principal. Individual investor circumstances vary significantly, and information gleaned from my articles should be applied to your own unique investment situation, objectives, risk tolerance, and investment horizon. Disclosure: I am/we are long SPLV, SPY. (More…) I wrote this article myself, and it expresses my own opinions. I am not receiving compensation for it (other than from Seeking Alpha). I have no business relationship with any company whose stock is mentioned in this article. Scalper1 News
Scalper1 News