Tag Archives: seeking

UNG Is Down For December — Will Cold Weather Pull It Back Up?
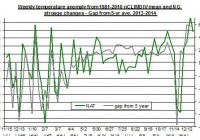
Summary The extraction from storage is projected to be lower than normal again this week. The temperatures are projected to come down in the next two weeks, but this isn’t expected to bring back up UNG. Contango is likely to keep UNG below natural gas prices. The price of The United States Natural Gas ETF (NYSEARCA: UNG ) took another fall in the past week to its lowest level in recent months. The ETF did bounce back earlier this week, but is still down for the month by nearly 24%. The ongoing low oil prices may have contributed to weakness of UNG, but the main issue will remain in changes in weather expectations . The level of underground storage is also likely to play a role in the progress of UNG. This was the case last week. This week’s extraction is likely to also be lower than normal for the season. As I pointed out in the past , the changes in the weather are likely to play a significant role in the changes in U.S. storage levels. Last week’s lower-than-expected withdrawal may have contributed to the drop in UNG on the day of the publication. I say this with caution because the linear correlation between the changes in UNG and storage tends to be low. Nonetheless, there are occasions when the market seems to react to this news, as seems to be the case last week. Looking forward, the storage is expected to show another lower than normal extraction due to last week’s higher than normal average temperature, as presented in the chart below. Source of data: EIA and national climate data center The chart shows the progress of the deviation in the national weather from normal and the weekly changes in natural gas storage with respect to the 5 year average (The data only refer to 2012/2013 and 2014 winter time). Moreover, the linear correlation between the two data sets is a strong and positive linear correlation of 0.62. Last week, the deviation from normal temperatures was, on average, 4.9. So all things being equal, we are likely to see another lower than normal extraction. Keep in mind that even if natural gas prices were to recover, the ongoing Contango in the future markets is likely to result in UNG underperforming natural gas for the near term. Cold weather ahead For the next two weeks, however, temperatures are projected to fall below average temperature throughout the Northeast and Midwest. Nonetheless, on a national level, the heating degrees for this week are expected to be slightly below normal and last year’s levels. This could suggest the demand for heating purposes in the residential/commercial sectors, while may rise in the coming days, won’t necessarily increase more than normal for this time of the year. The recent withdrawal from storage was 49 Bcf, which was well below the 5-year average and last year’s extraction of 138 Bcf and 177 Bcf, respectively. The table below summarizes the changes in storage in the past few weeks and the comparison to last year and the 5-year average levels. Source of data EIA Following the recent extraction the underground natural gas storage is at 3,246 Bcf. This is nearly 5% higher than last year’s storage level and only 5% below the 5-year average. Over the next couple of weeks we are likely to see another lower than normal extraction from storage, which could fuel another fall in the price of UNG or at the very least keep it from recovering. But if temperatures start coming down to below normal levels, UNG may change course and start to rally.
There Is Great Diversification For SPHB, But It Still Carries Some Major Risks

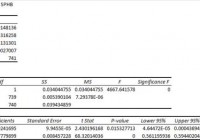
Summary I’m taking a look at SPHB as a candidate for inclusion in my ETF portfolio. The risk level makes me uncomfortable for anything over 5%. The ETF is very well diversified, just not into the kind of companies I want to hold. I’m not assessing any tax impacts. Investors should check their own situation for tax exposure. Investors should be seeking to improve their risk adjusted returns. I’m a big fan of using ETFs to achieve the risk adjusted returns relative to the portfolios that a normal investor can generate for themselves after trading costs. I’m working on building a new portfolio and I’m going to be analyzing several of the ETFs that I am considering for my personal portfolio. One of the funds that I’m considering is the PowerShares S&P 500 High Beta Portfolio (NYSEARCA: SPHB ). I’ll be performing a substantial portion of my analysis along the lines of modern portfolio theory, so my goal is to find ways to minimize costs while achieving diversification to reduce my risk level. What does SPHB do? SPHB attempts to track the total return of the S&P 500® High Beta Index. At least 90% of funds are invested in companies that are part of the index. SPHB falls under the category of “Mid-Cap Blend”. Does SPHB provide diversification benefits to a portfolio? Each investor may hold a different portfolio, but I use (NYSEARCA: SPY ) as the basis for my analysis. I believe SPY, or another large cap U.S. fund with similar properties, represents the reasonable first step for many investors designing an ETF portfolio. Therefore, I start my diversification analysis by seeing how it works with SPY. I start with an ANOVA table: (click to enlarge) The correlation is about 86%. It is low enough to provide some diversification benefits relative to holding SPY, but the benefits won’t be huge so if the standard deviation of returns is too high it may still be difficult to fit SPHB into a portfolio. Standard deviation of daily returns (dividend adjusted, measured since January 2012) The standard deviation is terrible. For SPHB it is 1.1739%. For SPY, it is 0.7300% for the same period. SPY usually beats other ETFs in this regard, but that is a very high standard deviation. Granted, it should be assumed that a high beta portfolio would have a high standard deviation of returns. Under CAPM (Capital Asset Pricing Model) the level of expected return should be easily determined by the beta of the stock. I think high beta stocks frequently more risk than they compensate for with returns. Therefore, I have a bias towards lower levels of beta. In the context of an entire portfolio, I can see the potential for benefits from using a small position in higher beta ETFs with free rebalancing to limit the amount of risk being created. Mixing it with SPY I also run comparisons on the standard deviation of daily returns for the portfolio assuming that the portfolio is combined with the S&P 500. For research, I assume daily rebalancing because it dramatically simplifies the math. With a 50/50 weighting in a portfolio holding only SPY and SPHB, the standard deviation of daily returns across the entire portfolio is 0.9359%. If we drop the position to 20% the standard deviation goes down to .8068%. In my opinion, that’s still too high. Once we drop it down to a 5% position the standard deviation is .7484%. I think 5% is about the largest position I’d consider here. Why I use standard deviation of daily returns I don’t believe historical returns have predictive power for future returns, but I do believe historical values for standard deviations of returns relative to other ETFs have some predictive power on future risks and correlations. Yield & Taxes The distribution yield is 0.88%. The ETF isn’t designed to cover the living expenses of retirees and in my opinion the risk level of the ETF combined with the low yield should encourage retirees to only consider positions even smaller than 5%. With the right level of diversification the ETF can still be used, but it isn’t built to meet those needs. I’m not a CPA or CFP, so I’m not assessing any tax impacts. If I were using SPHB, I would want it to be in a tax exempt account to remove any headaches associated with frequent rebalancing. Expense Ratio The ETF is posting .25% for an expense ratio. I want diversification, I want stability, and I don’t want to pay for them. In my opinion, a .25% expense ratio is higher than I want to pay for equity investments. It’s still low relative to many other methods of investing, but I’m looking for long term holdings and I don’t want to give my investments away. Market to NAV The ETF is at a .03% premium to NAV currently. In my opinion, that’s not worth worrying about. It is practically trading right on top of NAV. However, premiums or discounts to NAV can change very quickly so investors should check prior to putting in an order. Largest Holdings The portfolio is very well diversified. Despite my lack of interest in holding higher beta portfolios, I still appreciate the great level of diversification. The top holding is barely over 1.5% of the portfolio. That is great. Check out the chart below: (click to enlarge) Conclusion I’m currently screening a large volume of ETFs for my own portfolio. The portfolio I’m building is through Schwab, so I’m able to trade SPHB with no commissions. I have a strong preference for researching ETFs that are free to trade in my account, so most of my research will be on ETFs that fall under the “ETF OneSource” program. At this point I’m a little skeptical, but I’ll have to test the impacts of the ETF in a heavily diversified portfolio. If I do include SPHB, it will probably be a position of 5% or less. The most likely result is that I will decide to exclude SPHB from my portfolio.

Dallas Fed Fisher’s Prescience And GLD

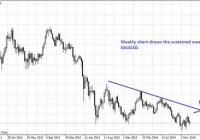
Recent third quarter GDP growth of 5% at 11 years high brings credibility to Fisher’s bullish dissent which is unforeseen by the FOMC. This brings greater possibility of an earlier rate hike forward to the March or April 2015 meeting especially if it is reflected in the upcoming labor figure. GLD paused its decline in this quiet festive market. This is the time to go short GLD before the market resumes fully in the second week of 2015. Voting against the action were Richard W. Fisher, who believed that, while the Committee should be patient in beginning to normalize monetary policy, improvement in the U.S. economic performance since October has moved forward, further than the majority of the Committee envisions, the date when it will likely be appropriate to increase the federal funds rate.” The quote is extracted from the statement of the Federal Open Market Committee (FOMC) released on 17 December 2014 . Dallas Federal Reserve President Richard Fisher took on a more bullish stance than the rest of the committee. During the meeting, the FOMC took reference from the October 2014 economic data and came to a bullish stance where you can read on my previous article ‘ Dissents At The December 2014 FOMC Meeting Hints At Earlier Rate Hikes ‘. At that point, I was not very convinced about Fisher’s outlook as I believe were the case of the rest of the FOMC. The US were showing some strong number such as the November 2014 non farm payroll of 321,000 which is better than the previous reading of 243,000 and expectations of 231,000 and average hourly earnings increase of 0.4% over 0.1% in October and 0.2% of market expectations. However there were misses as well such as the 0.3% contraction of the consumer price index in November after no change in October. Flash manufacturing purchasing manager index came in lower at 53.7 in November compared to a 54.8 reading in October and market expectations of 56.1. However with the 23 December 2014 revision of the third quarter 2014 from 3.9% to 5.0% which is not seen in 11 years since the third quarter of 2003, I am beginning to think that Fisher might be prescient in his observation. The FOMC will meet again next month from 27 to 28 January 2015. They will observe that GDP grew by 5.0% in the third quarter of 2014, at a 11 year high and agree with Fisher’s observation. During Chair Janet Yellen’s latest press conference , she had the following projection about GDP growth: The central tendency of the projections for real GDP growth is 2.3 to 2.4 percent for 2014, up a bit from the September projections.” The fact that GDP grew at such a rapid rate should persuade the Fed to raise rates at an earlier date perhaps in the March or April meetings instead of the June meeting as widely expected in the market. This would be so especially if there is continued improvement in the labor market. Hence we should keep a lookout for 09 January 2015 figures for the non-farm payroll and unemployment rate data. During the same press conference, Yellen set an unemployment target of 5.2% to 5.3% in the quote below: The central tendency of the unemployment rate projections is slightly lower than in the September projections and now stands at 5.2 to 5.3 percent at the end of next year, in line with its estimated longer-run normal level.” However I don’t think that the FOMC would start rising rates when unemployment rate is at 5.2% -5.3%. Instead I am of the opinion that they would start to rise rates as unemployment start to move towards their target as GDP grows. This would obviously be bullish on the United States Dollars (USD) after the market returns from the holiday season on the second week of 2015. Then I turned my thoughts to gold. You might have heard of this argument in one form or another before but it is worth repeating. As the US rises interest rates, it will be more expensive to hold onto gold as it gives no return and in fact cost you in terms of insurance and storage if you were to hold physical gold. Of course, there is the theory that holding gold is an insurance against the economic collapse but this is getting less and less traction especially with GDP growth of 5%. Then there is the argument that gold is a hedge against inflation but inflation is low and even the Fed foresees 1.0% to 1.6% inflation for 2015 if you refer to Yellen’s press conference. However, today I am going to offer a slight twist to it. The USD has not responded much to the record 11 year high GDP reading. You can read about it in my article ‘ USD Asleep As Q3 2014 GDP Hits 11 Years High ‘. In normal trading day, we would have seen USD raise by at least 100 pips but today if you are reading it before the market returns from the holiday, you might be in a position to short gold at a good price as gold gains partial strength by default after sustained selling in the past week with a lesser possibility of being hit by a retracement. Even if you miss the chance to sell gold by the time you read it, you can also sell it but with a wider stop loss. You can take the daily volatility as a guide. (click to enlarge) (click to enlarge) The 2 charts above shows the weekly and daily chart of XAU/USD. XAU is the symbol for gold while USD represents United States Dollar which we are all familiar with. The weekly chart shows that this pair is under constant pressure even if there are periodic upticks. The current weekly chart looks like it is on the downtrend after completing its recent bounce to a high of $1238 two weeks back. The daily chart shows us that the XAU/USD is having one of its uptick but this is likely to be temporary. This is a function of the thin trading market during the festive season and traders can take this opportunity to sell and set their stop loss at $1230. Of course, there is no sure thing in trading and one should set the position size accordingly. For those who want to avoid the leverage inherent in forex, they should use the SPDR Gold Trust ETF (NYSEARCA: GLD ) instead. GLD is listed on the New York Stock Exchange and highly liquid with $26.90 billion of market capitalization and transaction volume of 1.5 million shares. (click to enlarge) The chart above shows the weakness of the GLD after the peak 2 weeks back which is an interim retracement. Now is the time to go short the GLD as it pauses before its downtrend and catch the trend before it slowly resumes again next week.