Tag Archives: seeking

GAL Is An ETF Built From Other ETFs, Let’s Peer Inside
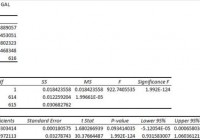
Summary I’m taking a look at GAL as a candidate for inclusion in my ETF portfolio. The description of GAL in the prospectus is a little weird, but I can provide a simpler one. The correlation to SPY is remarkably low for an ETF that holds 24% of the portfolio in shares of SPY. The ETF looks more appealing to investors that are constrained by commissions on trading ETFs. For investors that can build their own portfolio commission free, it is less appealing. I’m not assessing any tax impacts. Investors should check their own situation for tax exposure. Investors should be seeking to improve their risk adjusted returns. I’m a big fan of using ETFs to achieve the risk adjusted returns relative to the portfolios that a normal investor can generate for themselves after trading costs. I’m working on building a new portfolio and I’m going to be analyzing several of the ETFs that I am considering for my personal portfolio. One of the funds that I’m considering is the SPDR SSgA Global Allocation ETF (NYSEARCA: GAL ). I’ll be performing a substantial portion of my analysis along the lines of modern portfolio theory, so my goal is to find ways to minimize costs while achieving diversification to reduce my risk level. What does GAL do? GAL is a relatively weird ETF compared to most of the ETFs I have covered. Lacking a better option, I’m going to begin by quoting the prospectus: Under normal circumstances, the Fund invests substantially all of its assets in the SSgA Global Allocation Portfolio (the “Portfolio”), a separate series of the SSgA Master Trust with an identical investment objective as the Fund. As a result, the Fund invests indirectly through the Portfolio. As an analyst, I’m used to digging through complicated statements, but I’m no familiar with the incentives for this structure. I expect most readers won’t know what to make of that either, so I’m providing an alternate description based on my understanding of the ETF. In my estimation, GAL is an ETF that purchases shares in several other ETFs. That should be simple enough to understand, and it’ll make perfect sense when we get to the section on holdings. The category for GAL is “World Allocation.” Does GAL provide diversification benefits to a portfolio? Each investor may hold a different portfolio, but I use the SPDR S&P 500 Trust ETF (NYSEARCA: SPY ) as the basis for my analysis. I believe SPY, or another large cap U.S. fund with similar properties, represents the reasonable first step for many investors designing an ETF portfolio. Therefore, I start my diversification analysis by seeing how it works with SPY. I start with an ANOVA table: (click to enlarge) The correlation is way better than I would expect. The correlation in this regression is 75%. I want to see low correlations on my international investments. Extremely low levels of correlation are wonderful for establishing a more stable portfolio. I consider anything under 50% to be extremely low. However, for equity securities an extremely low correlation is frequently only found when there are substantial issues with trading volumes that may distort the statistics. Standard deviation of daily returns (dividend adjusted, measured since July 2012) The standard deviation is incredible. For GAL it is .5495%. For SPY, it is 0.7063% for the same period. SPY usually beats other ETFs in this regard, so a lower volatility level is very impressive. Because the ETF has fairly low correlation for equity investments and a low standard deviation of returns, it should do fairly well under modern portfolio theory. Liquidity looks fine Average trading volume isn’t very high, a bit over 55,000, but that also isn’t low enough to be a major concern for me. This is extremely important to the analysis of GAL because the combination of low standard deviation and low correlation immediately set off red flags to watch for low levels of liquidity that might distort the statistics. Mixing it with SPY I also run comparisons on the standard deviation of daily returns for the portfolio assuming that the portfolio is combined with the S&P 500. For research, I assume daily rebalancing because it dramatically simplifies the math. With a 50/50 weighting in a portfolio holding only SPY and GAL, the standard deviation of daily returns across the entire portfolio is 0.5921%. With 80% in SPY and 20% in GAL, the standard deviation of the portfolio would have been .6539%. If an investor wanted to use GAL as a supplement to their portfolio, the standard deviation across the portfolio with 95% in SPY and 5% in GAL would have been .6925%. Why I use standard deviation of daily returns I don’t believe historical returns have predictive power for future returns, but I do believe historical values for standard deviations of returns relative to other ETFs have some predictive power on future risks and correlations. Yield & Taxes The distribution yield is 2.65%. This ETF could be worth considering for retiring investors. I like to see strong yields for retiring portfolios because I don’t want to touch the principal. In my opinion, anything over 2% is high enough to warrant some consideration. Overall, a 2% yield on a portfolio wouldn’t be great for covering retirement costs, but I wouldn’t fill the portfolio with only high yield investments. By investing in ETFs I’m removing some of the human emotions, such as panic. Higher yields imply lower growth rates (without reinvestment) over the long term, but that is an acceptable trade off in my opinion. I’m not a CPA or CFP, so I’m not assessing any tax impacts. Expense Ratio The ETF is posting a .35% expense ratio. I want diversification, I want stability, and I don’t want to pay for them. The expense ratio on this fund is higher than I want to pay for equity securities, but not high enough to make me eliminate it from consideration. I view expense ratios as a very important part of the long term return picture because I want to hold the ETF for a time period measured in decades. Market to NAV The ETF is at a .27% premium to NAV currently. Premiums or discounts to NAV can change very quickly so investors should check prior to putting in an order. The ETF is large enough and liquid enough that I would expect the ETF to stay fairly close to NAV. Generally, I don’t trust deviations from NAV and I will have a strong resistance to paying a premium to NAV to enter into a position. Largest Holdings The diversification looks terrible if you are only looking at the percentage of the fund in each investment. However, since the investments are other ETFs, the actual diversification is phenomenal. This level of diversification is the reason the fund has such a low level of volatility. A chart of the holdings by market value is available below: (click to enlarge) Conclusion I’m currently screening a large volume of ETFs for my own portfolio. The portfolio I’m building is through Schwab, so I’m able to trade GAL with no commissions. I have a strong preference for researching ETFs that are free to trade in my account, so most of my research will be on ETFs that fall under the “ETF OneSource” program. I’m having a difficult time deciding what to think on GAL. It’s the first ETF filled with ETFs that I’ve analyzed. I’m curious about the expense ratio. Before investing in GAL, I would want to know if the .35% expense ratio was strictly the amount that went to the managers of GAL, or if was including all fees charged at all levels of the portfolio. As investors, we already have to pay management of the company and the expense ratio of one ETF; I don’t want to pay the expense ratios twice. However, the correlation to SPY is remarkably low for an ETF that is already holding SPY as nearly a quarter of the portfolio. In my opinion, GAL looks like a better option for investors that are paying commissions on every trade. For those investors, a position in GAL could be combined with a position in SPY (or a similar ETF). If the investor was facing commissions on trades that encouraged them to hold a smaller number of ETFs directly, this could be a viable way of constructing the portfolio. For investors that are have access to a large volume of commission free ETFs, the appeal of GAL is much weaker. Despite the complications on the expenses, I may run more statistics on GAL in a diversified portfolio. It might still be worth a 2% to 5% allocation. The efficient frontier on portfolio structures doesn’t take into account the amount of time required to build very tiny positions in obscure securities. I would be willing to pay some additional expense ratio for that exposure. Additional disclosure: Information in this article represents the opinion of the analyst. All statements are represented as opinions, rather than facts, and should not be construed as advice to buy or sell a security. Ratings of “outperform” and “underperform” reflect the analyst’s estimation of a divergence between the market value for a security and the price that would be appropriate given the potential for risks and returns relative to other securities. The analyst does not know your particular objectives for returns or constraints upon investing. All investors are encouraged to do their own research before making any investment decision. Information is regularly obtained from Yahoo Finance, Google Finance, and SEC Database. If Yahoo, Google, or the SEC database contained faulty or old information it could be incorporated into my analysis. The analyst holds a diversified portfolio including mutual funds or index funds which may include a small long exposure to the stock.
Selecting An Emerging Markets Value ETF

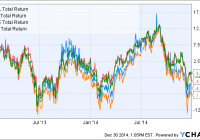
Summary Emerging markets have struggled over the past several years and may deserve a second look today. Value is a validated factor for outperformance that also works in emerging markets. This article analyzes three emerging market value ETFs in comparison to the benchmark EEM. Introduction In a previous article on emerging market low-volatility ETFs, we remarked that emerging markets had performed very well for most of the last decade, but have struggled coming out of the financial recession. This has made emerging markets one of the two cheapest global regions today (the other is Asia ex-Japan). Besides low volatility, “value” is an another factor that has been documented to lead to stock outperformance. In a recent paper from Robeco Asset Management, value, low-volatility, size and momentum premia were (re)confirmed to exist in emerging markets. Therefore, I was also interested to analyze the composition of several emerging market value ETFs to see which would be the best one to include in my own portfolio. Emerging market value funds The emerging market (EM) value funds under consideration are: iShares MSCI Emerging Markets Value ETF (NASDAQ: EVAL ), PowerShares FTSE RAFI Emerging Markets Portfolio (NYSEARCA: PXH ), and FlexShares Morningstar Emerging Markets Factor Tilt Index Fund (NYSEARCA: TLTE ). The benchmark iShares MSCI Emerging Markets ETF (NYSEARCA: EEM ) is also included for comparison. EVAL seeks to track the investment results of an index composed of emerging market equities that exhibit value characteristics. RAFI is fundamental-weighted ETF that selects and weights securities based on book value, cash flow, sales and dividends. TLTE seeks to enhance exposure to emerging markets by tilting the portfolio towards small-cap and value stocks. Fund details Data for EVAL, PXH, TLTE and EEM are shown below (source: Morningstar ). EVAL PXH TLTE EEM Yield 2.12% 3.05% 0.82% 1.69% Expense ratio 0.49% 0.49% 0.65% 0.67% Inception Feb 2012 Sep 2007 Sep 2012 Apr 2003 Assets $21.3M $367M $240M $32.2B Avg Vol. 2.7K 137K 21K 60.6M No. holdings 437 317 2057 817 Annual turnover 25% 24% 20% 22% We can see that PXH and TLTE are both relatively small funds, though their liquidity should still be sufficient for the average investor. EVAL is a tiny fund and has very low liquidity, which would result in higher bid-ask spreads. EEM, the benchmark ETF, is a giant by comparison. The expense ratios for the four EM funds are quite high, ranging from 0.49% to 0.67%, which is much higher than for domestic (US) funds. EVAL and PXH are both tied for the cheapest expense ratio at 0.49%, whereas TLTE has a higher expense ratio of 0.65%. The following table shows the top 10 holdings of the four funds. EVAL PXH TLTE EEM China Mobile 3.77 Gazprom 3.61 Samsung Electronics 2.31 Samsung Electronics 3.18 China Construction Bank 2.82 China Construction Bank 2.89 Taiwan Semiconductor Manufacturing 1.98 Taiwan Semiconductor Manufacturing 2.80 Industrial And Commercial Bank Of China 2.58 China Mobile 2.79 Tencent Holdings 1.44 Tencent Holdings 2.05 Bank of China 2.12 Industrial And Commercial Bank Of China 2.63 China Mobile 1.30 China Mobile 1.87 Hon Hai Precision 2.02 Taiwan Semiconductor Manufacturing 2.40 China Construction Bank 1.09 China Construction Bank 1.36 Gazprom 1.76 Bank Of China 2.34 Industrial And Commercial Bank Of China 0.99 Naspers 1.28 Mtn Group 1.62 Itau Unibanco Holding 2.14 Naspers 0.90 Industrial And Commercial Bank Of China 1.25 CNOOC 1.34 Petroleo Brasileiro 2.13 Itau Unibanco Holding 0.75 Itau Unibanco Holding 1.03 Hyundai Motor 1.27 Hon Hai Precision Ind 2.02 America Movil 0.74 Bank of China 1.02 Sasol 1.20 Reliance Industries 2.00 Bank Of China 0.70 America Movil 0.99 We can see these funds have quite a few of their top 10 holdings in common. Overlap The following table illustrates the overlap between the three EM value funds and EEM. Overlap statistics were obtained from ETF Research Center . EVAL PXH TLTE EEM EVAL – 49% 33% 52% PXH 49% – 35% 49% TLTE 33% 35% – 56% EEM 52% 49% 56% – We can see that there is a significant degree of overlap between the four funds. The three EM value funds have 33%-49% overlap between themselves, and 49%-56% overlap with EEM. In comparison, the low-volatility EM funds only had 2-31% overlap with EEM. The highest overlap is between TLTE and EEM (56%), while the lowest is between TLTE and EVAL (33%). Performance The graph below shows the performance of the three EM value funds and EEM since Dec. 2012 (2 years). EVAL Total Return Price data by YCharts We can see that the performances of the four funds have been relatively similar over the past two years. EEM has had the highest performance of -1.01%, followed by TLTE at -3.53% and EVAL at -4.25%. PXH had the worst return of -7.19%. The similar performances of the funds could be due to their significant amount of overlap between them. The following table shows further performance and risk data for the three EM value funds and EEM. Data are from Morningstar, except for volatility (2Y) and beta (2Y) which are from InvestSpy . EVAL PXH TLTE EEM 1-year return % -3.26 -5.59 -5.64 -3.04 3-year return (ann.)% – 0.01 – 3.22 5-year return (ann.)% – -1.96 – 0.93 Volatility (2Y) % 25.7% 18.2% 15.1% 17.3% Beta (2Y) 0.57 1.09 0.86 1.09 Sharpe ratio (3Y) – 0.15 – 0.37 Sharpe ratio (5Y) – 0.11 – 0.22 Surprisingly, EVAL apparently has a very high volatility compared to the other three funds, but a very low beta. However, I’m not sure if those metrics are reliable because EVAL is quite illiquid. When comparing PXH with EEM, we can see that the two funds have similar volatilities and betas. However, PXH has had a worse long-term performance. Valuation The table below shows various value and growth metrics for EVAL, PXH, TLTE and EEM. Data for all funds are from Morningstar (value metrics including dividend yield are forward looking). The first five rows can be considered as value metrics while the last five rows can be considered as growth metrics. EVAL PXH TLTE EEM Price/Earnings 10.06 9.51 11.78 12.76 Price/Book 1.08 1.02 1.26 1.49 Price/Sales 0.92 0.76 0.9 1.14 Price/Cash Flow 4.96 4.14 4.3 4.92 Dividend Yield % 3.62% 3.66% 2.72% 2.56% Projected Earnings Growth % 10.59 8.47 11.61 11.76 Historical Earnings Growth % -0.08 0.74 -28.77 -1.68 Sales Growth % -19.36 -11.82 -22.17 -13.79 Cash-flow Growth % 1.92 3.08 -3.97 7.85 Book-value Growth % -22.03 -27.25 -26.06 -21.57 We can see from the data above that all of the EM value funds have superior valuation metrics than EEM, as expected. Of the three EM value funds, PXH has the best valuation metrics, followed by TLTE. The funds also appear to have many negative growth metrics, which could be due to the effect of a global slowdown on the growth of many emerging market economies that rely heavily on exports or foreign investment. The EM value funds generally have worse growth metrics compared to EEM. Countries Perhaps the most important factor that would affect the performance of the EM value funds is the distribution of the constituent countries in the fund. The following table shows the top 10 countries in each of the three low-volatility EM funds and EEM (data from ETF Database ). EVAL PXH TLTE EEM China 20.60% China 24.48% China 20.01% China 17.52% Taiwan 12.69% Taiwan 14.54% South Korea 13.10% South Korea 13.64% South Korea 11.86% Brazil 11.30% Taiwan 12.22% Taiwan 12.20% India 7.35% Russia 8.89% India 8.51% Brazil 7.82% South Africa 7.23% South Africa 8.45% South Africa 7.73% South Africa 7.75% Mexico 5.26% India 7.92% Brazil 7.34% India 6.99% Brazil 4.56% Mexico 4.49% Mexico 4.53% Mexico 5.05% Malaysia 3.76% Turkey 3.18% Russia 4.08% Russia 3.94% Russia 3.69% Malaysia 2.54% Malaysia 3.73% Malaysia 3.66% Indonesia 2.70% Thailand 2.51% Indonesia 2.74% Indonesia 2.66% We can see from the above funds that all of them have China as the top holding. Taiwan also ranks prominently in all of the EM funds. South Korea is found as a top holding in all of the EM funds except PXH, probably because the FTSE Emerging Market Index does not include South Korea. I like the country distribution of PXH the most because it has the four cheapest EM countries as the top four holdings: China (PE: 7.1), Taiwan (PE: 13.9), Brazil (PE: 12.4) and Russia (5.5). Size The table below shows the size distribution for the four EM funds (data from Morningstar). EVAL PXH TLTE EEM Giant 49.7 58.6 36.4 50.6 Large 38.0 31.0 28.6 37.0 Medium 11.8 9.6 21.7 11.9 Small 0.5 0.8 13.1 0.4 Micro 0.0 0.0 0.2 0.1 And in graphical form: We can see that TLTE has the most even size distribution, as its investment mandate tilts its exposure towards smaller-cap stocks. EVAL, PXH and EEM have similar size distributions, with giant caps accounting for ~50% weight and large caps accounting for ~30% weight. Sector The final aspect to consider for the EM ETFs is their sector distribution. The following table shows the sector composition of the three EM value funds and EEM. Data are from Morningstar. EVAL PXH TLTE EEM Basic Materials 12.54 9.06 9.45 7.9 Consumer Cyclical 8.96 4.74 10.37 8.46 Financial Services 30.27 32.76 21.87 25.44 Real Estate 2.07 1.2 4.27 2.45 Communication Services 12.63 10.63 5.83 7.77 Energy 11.43 17.33 6.27 7.5 Industrials 5.49 3.85 8.58 5.72 Technology 8.84 13 18.61 20.95 Consumer Defensive 3.91 4.09 7.52 8.28 Healthcare 0.14 0.39 3.01 2.24 Utilities 3.72 2.97 4.23 3.3 And in graphical form: Similar to the low-volatility EM funds described in the previous article, financials again make up the highest allocation of the EM value funds. PXH also has a relatively high allocation towards energy, while TLTE and EEM have higher technology allocations. The following graph shows the sector distribution of the four funds (individual sectors are not marked). We can see that TLTE has the most even sector distribution out of the four funds. Conclusion The three low-volatility funds have had quite similar perfomances over the past two years, which could be due to the relatively high degrees of overlap between the funds. My pick for an EM value fund for my own portfolio was a close call between PXH and TLTE. (Unfortunately EVAL has to be excluded due to its low liquidity). TLTE had better sector and size distributions than PXH, and also exhibited a slightly better performance than PXH over the last two years. However, PXH has a slightly lower expense ratio (0.49%) and superior value metrics compared to TLTE. PXH also pays the highest dividend yield (3.05%) out the four EM funds studied. Finally, PXH contained a greater proportion of its weight in low PE countries. In the end, given that I was looking for an EM value fund, I selected PXH, the more “valuey” of the two funds, for my portfolio.

ACIM Appears To Have Incredibly Low Risk, But That’s Inaccurate

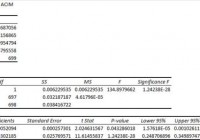
Summary I’m taking a look at ACIM as a candidate for inclusion in my ETF portfolio. The correlation appears to be very low, but the low liquidity caused days with no trades. The same liquidity issues might have improved the standard deviation of returns. The premium to NAV makes it look like a potential short candidate. I’m not assessing any tax impacts. Investors should check their own situation for tax exposure. Investors should be seeking to improve their risk adjusted returns. I’m a big fan of using ETFs to achieve the risk adjusted returns relative to the portfolios that a normal investor can generate for themselves after trading costs. I’m working on building a new portfolio and I’m going to be analyzing several of the ETFs that I am considering for my personal portfolio. One of the funds that I’m considering is the SPDR® MSCI ACWI IMI ETF (NYSEARCA: ACIM ). I’ll be performing a substantial portion of my analysis along the lines of modern portfolio theory, so my goal is to find ways to minimize costs while achieving diversification to reduce my risk level. What does ACIM do? ACIM attempts to track the total return of the MSCI ACWI IMI Index. At least 80% of funds are invested in companies that are part of the index, or in ADRs (American Depositary Receipts). ACIM falls under the category of “World Stock”. Does ACIM provide diversification benefits to a portfolio? Each investor may hold a different portfolio, but I use (NYSEARCA: SPY ) as the basis for my analysis. I believe SPY, or another large cap U.S. fund with similar properties, represents the reasonable first step for many investors designing an ETF portfolio. Therefore, I start my diversification analysis by seeing how it works with SPY. I start with an ANOVA table: (click to enlarge) The correlation is an absurdly low 40%. If an investor stopped here, they would be dramatically misinformed about the risks of ACIM. The correlation is very low as a statistical measure, but the metric is being substantially enhanced by a lack of liquidity in the stock which caused several days to report no change in the price of securities. Standard deviation of daily returns (dividend adjusted, measured since March 2012) The standard deviation is excellent for the international exposure. For ACIM it is .9981%. For SPY, it is 0.7419% for the same period. SPY usually beats other ETFs in this regard, so having a lower standard deviation is excellent. Frequent readers should be aware that I have measured returns from March 2012 instead of my normal starting point of January 2012. I can’t measure values until the ETF is trading and Yahoo is tracking the dividend adjusted close values. Unfortunately, the standard deviation may appear substantially smaller than it should because several days (especially in 2012) reported no change in price. When no sales are reported, the price is not changed and it looks like a low standard deviation of returns. Investors should be aware that there is substantial liquidity risk. The average volume for the last 10 days is only 6,837. Mixing it with SPY I also run comparisons on the standard deviation of daily returns for the portfolio assuming that the portfolio is combined with the S&P 500. For research, I assume daily rebalancing because it dramatically simplifies the math. With a 50/50 weighting in a portfolio holding only SPY and ACIM, the standard deviation of daily returns across the entire portfolio is 0.7320%. If an investor wanted to use ACIM as a supplement to their portfolio, the standard deviation across the portfolio with 95% in SPY and 5% in ACIM would have been .7263%. However, due to the very low correlation, a position of 80% SPY combined with 20% ACIM results in a standard deviation for the portfolio of only .6982%. Investors hoping to capitalize on this low standard deviation of returns would need to have a relatively low need for liquidity since the price stability only works if no large sell orders are being introduced. Why I use standard deviation of daily returns I don’t believe historical returns have predictive power for future returns, but I do believe historical values for standard deviations of returns relative to other ETFs have some predictive power on future risks and correlations. Yield & Taxes The distribution yield is 1.84%. The yield is almost high enough for a retiring investor, in my opinion. Generally, I want to see yields over 2% when considering an ETF for retirement planning. This is close enough that I could still consider it from the perspective of a retiree, but only if the retiree was certain they did not have liquidity needs. I’m not a CPA or CFP, so I’m not assessing any tax impacts. Expense Ratio The ETF is posting .25% for an expense ratio. I want diversification, I want stability, and I don’t want to pay for them. The expense ratio on this fund is higher than I want to pay, but isn’t unbearable for the incredible diversification. Market to NAV The ETF is at a 1.85% premium to NAV currently. Premiums or discounts to NAV can change very quickly so investors should check prior to putting in an order. I wouldn’t want to pay a premium greater than .1% when investing in an ETF. There might be some situations where I would pay .2%, but you won’t see me agreeing to pay that premium. Not happening. If I took a position in this ETF it would be with a carefully monitored limit buy order that adjusted for the premium. If sell orders dropped it to my price, great, if not, I’d rather avoid the ETF entirely than pay that premium. Largest Holdings ACIM has great diversification when you look at the percent in each asset, but the top of the portfolio still has a huge tilt towards the U.S. economy. (click to enlarge) These aren’t bad stocks to hold, but I can get them by holding any of several major ETFs that hold major U.S. companies. The appeal of a world portfolio is having substantial exposure to other markets to help balance out the geographic risks of a U.S. based portfolio. This collection of top holdings supports my belief that the correlation is understated because favorable impacts from days where reported closing price did not change. If ACIM drops to trade at a discount to NAV, I may become very interested in it. Otherwise, regardless of the statistics, I’m not interested in paying a premium for an ETF that holds several of the same companies I can acquire without the premium. Conclusion I’m currently screening a large volume of ETFs for my own portfolio. The portfolio I’m building is through Schwab, so I’m able to trade ACIM with no commissions. I have a strong preference for researching ETFs that are free to trade in my account, so most of my research will be on ETFs that fall under the “ETF OneSource” program. I think the statistics for the ETF are misleading and premium to NAV looks like a poor bet for future returns. When this ETF trades near NAV, it may have some value to investors. I may take a deeper look at it in the future, but for now I think the low liquidity and premium NAV present a real challenge to including it in my portfolio. Due to low liquidity and the potential need to execute a trade over multiple days to create or sell a reasonable position, I would not consider this ETF at all from any account that was required to pay trading commissions on the ETF. If I can short ETFs that are overpriced (without commission), it might become appealing to initiate shorts on the ETF when it is trading over book value if I can own substantially the same securities through other ETFs without paying a premium to acquire them. Additional disclosure: Information in this article represents the opinion of the analyst. All statements are represented as opinions, rather than facts, and should not be construed as advice to buy or sell a security. Ratings of “outperform” and “underperform” reflect the analyst’s estimation of a divergence between the market value for a security and the price that would be appropriate given the potential for risks and returns relative to other securities. The analyst does not know your particular objectives for returns or constraints upon investing. All investors are encouraged to do their own research before making any investment decision. Information is regularly obtained from Yahoo Finance, Google Finance, and SEC Database. If Yahoo, Google, or the SEC database contained faulty or old information it could be incorporated into my analysis. The analyst holds a diversified portfolio including mutual funds or index funds which may include a small long exposure to the stock.