Tag Archives: seeking

SDOG Looks Great For Retirees Seeking Dividend Yields With Stability
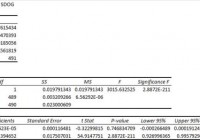
Summary I’m taking a look at SDOG as a candidate for inclusion in my ETF portfolio. The expense ratio is a bit high, but the total returns have been similar to SPY. The dividend yield (3.20%) makes this ETF particularly attractive to retiring investors that want stronger yields. I’m putting SDOG in my list of potential ETFs to use for building my portfolio. I’m not assessing any tax impacts. Investors should check their own situation for tax exposure. Investors should be seeking to improve their risk adjusted returns. I’m a big fan of using ETFs to achieve the risk adjusted returns relative to the portfolios that a normal investor can generate for themselves after trading costs. I’m working on building a new portfolio and I’m going to be analyzing several of the ETFs that I am considering for my personal portfolio. One of the funds that I’m considering is the ALPS Sector Dividend Dogs ETF (NYSEARCA: SDOG ). I’ll be performing a substantial portion of my analysis along the lines of modern portfolio theory, so my goal is to find ways to minimize costs while achieving diversification to reduce my risk level. What does SDOG do? SDOG attempts to track the total return (before fees and expenses) of the S-Network Sector Dividend Dogs Index. At least 90% of the assets are invested in funds included in this index. SDOG falls under the category of “Large Value”. Does SDOG provide diversification benefits to a portfolio? Each investor may hold a different portfolio, but I use (NYSEARCA: SPY ) as the basis for my analysis. I believe SPY, or another large cap U.S. fund with similar properties, represents the reasonable first step for many investors designing an ETF portfolio. Therefore, I start my diversification analysis by seeing how it works with SPY. I start with an ANOVA table: (click to enlarge) The correlation is about 93% according to the regression. That is low enough that it appears to offer some diversification benefits. Extremely low levels of correlation are wonderful for establishing a more stable portfolio. I consider anything under 50% to be extremely low. However, for equity securities an extremely low correlation is frequently only found when there are substantial issues with trading volumes that may distort the statistics. Standard deviation of daily returns (dividend adjusted, measured since January 2013) The standard deviation is great. For SDOG it is .6611%. For SPY, it is 0.6851% for the same period. SPY usually beats other ETFs in this regard, so a lower volatility level is very impressive. Because the ETF has fairly low correlation for equity investments and a low standard deviation of returns, it should do fairly well under modern portfolio theory. Liquidity looks fine Average trading volume is high enough for me, a bit over 140,000. Mixing it with SPY I also run comparisons on the standard deviation of daily returns for the portfolio assuming that the portfolio is combined with the S&P 500. For research, I assume daily rebalancing because it dramatically simplifies the math. With a 50/50 weighting in a portfolio holding only SPY and SDOG, the standard deviation of daily returns across the entire portfolio is 0.6608%. With 80% in SPY and 20% in SDOG, the standard deviation of the portfolio would have been .6726%. If an investor wanted to use SDOG as a supplement to their portfolio, the standard deviation across the portfolio with 95% in SPY and 5% in SDOG would have been .6816%. Why I use standard deviation of daily returns I don’t believe historical returns have predictive power for future returns, but I do believe historical values for standard deviations of returns relative to other ETFs have some predictive power on future risks and correlations. Yield & Taxes The distribution yield is 3.20%. That appears to be a respectable yield. I’m quite happy with the yield and the strong yield makes this fund worth considering for retiring investors that plan to live off the yield. I prefer a strong dividend yield to “creating your own dividends” by selling shares because one of the reasons for ETF investing is that it removes the human emotions. There is less temptation to freak out and sell when the market is down if the investor is simply living from the dividends and doesn’t need to check in on the portfolio. I’m not a CPA or CFP, so I’m not assessing any tax impacts. Expense Ratio The ETF is posting .40% for an expense ratio (net and gross). I want diversification, I want stability, and I don’t want to pay for them. The expense ratio on this fund is higher than I want to pay for equity securities, but not high enough to make me eliminate it from consideration. I view expense ratios as a very important part of the long term return picture because I want to hold the ETF for a time period measured in decades. Market to NAV The ETF is at a .05% premium to NAV currently. Premiums or discounts to NAV can change very quickly so investors should check prior to putting in an order. The ETF is large enough and liquid enough that I would expect the ETF to stay fairly close to NAV. Generally, I don’t trust deviations from NAV and I will have a strong resistance to paying a premium to NAV to enter into a position. Largest Holdings The diversification within the ETF is mediocre. The top 10 are all over 2%, which isn’t terrible but feels pretty weak for an ETF with an expense ratio of .40%. What exactly are investors receiving for that expense ratio? The best argument for accepting the expense ratio, in my opinion, is that the dividend yield may be strong enough to keep people from selling their shares when the market is down. If the strong dividend yield can convince casual investors to avoid human errors, then the expense ratio is a fine price to pay. (click to enlarge) Conclusion I’m currently screening a large volume of ETFs for my own portfolio. The portfolio I’m building is through Schwab, so I’m able to trade SDOG with no commissions. I have a strong preference for researching ETFs that are free to trade in my account, so most of my research will be on ETFs that fall under the “ETF OneSource” program. The best part is clearly the dividend and the worst part is the expense ratio. For someone that is living off the yield and trying to keep their hands off the investment, SDOG is a very viable option. The reasonable level of liquidity is a huge benefit if a life event forces the shareholder to sell, but the strong dividend yield should reduce the temptation to mess with the account. I’m going to keep SDOG in my list of contenders for a spot in the portfolio. I intend to allocate part of the portfolio to an ETF that is similar to SPY but with an emphasis on stronger dividends. SDOG will be competing with other ETFs like (NYSEARCA: SCHD ) for that role. Additional disclosure: Information in this article represents the opinion of the analyst. All statements are represented as opinions, rather than facts, and should not be construed as advice to buy or sell a security. Ratings of “outperform” and “underperform” reflect the analyst’s estimation of a divergence between the market value for a security and the price that would be appropriate given the potential for risks and returns relative to other securities. The analyst does not know your particular objectives for returns or constraints upon investing. All investors are encouraged to do their own research before making any investment decision. Information is regularly obtained from Yahoo Finance, Google Finance, and SEC Database. If Yahoo, Google, or the SEC database contained faulty or old information it could be incorporated into my analysis. The analyst holds a diversified portfolio including mutual funds or index funds which may include a small long exposure to the stock.
WDIV Could Be Fun If Prices Deviate From NAV With Poor Liquidity

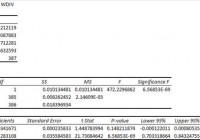
Summary I’m taking a look at WDIV as a candidate for inclusion in my ETF portfolio. Poor liquidity ruins the reliability of statistics and creates significant spreads during trading hours. The correlation to SPY looks low, but I can’t trust it because of the liquidity issues. If an investor is using a tax advantaged account that doesn’t pay commissions on trading the ETF, it could be interesting to play the spreads and deviations from NAV. I’m not assessing any tax impacts. Investors should check their own situation for tax exposure. Investors should be seeking to improve their risk adjusted returns. I’m a big fan of using ETFs to achieve risk adjusted returns relative to the portfolios that normal investors can generate for themselves after trading costs. I’m working on building a new portfolio and will be analyzing several of the ETFs that I am considering for my personal portfolio. One of the funds that I’m considering is the SPDR S&P Global Dividend ETF (NYSEARCA: WDIV ). I’ll be performing a substantial portion of my analysis along the lines of modern portfolio theory, so my goal is to find ways to minimize costs while achieving diversification to reduce my risk level. What does WDIV do? WDIV attempts to track the total return (before fees and expenses) of an unnamed index that tracks the stocks of global companies with strong dividends. At least 80% of the assets are invested in those companies, or ADRs that represent those companies. WDIV falls under the category of “World Stock”. Does WDIV provide diversification benefits to a portfolio? Each investor may hold a different portfolio, but I use the SPDR S&P 500 Trust ETF (NYSEARCA: SPY ) as the basis for my analysis. I believe SPY, or another large cap U.S. fund with similar properties, represents the reasonable first step for many investors designing an ETF portfolio. Therefore, I start my diversification analysis by seeing how it works with SPY. I start with an ANOVA table: (click to enlarge) The correlation is excellent at 74%. I want to see low correlations on my international investments. Extremely low levels of correlation are wonderful for establishing a more stable portfolio. I consider anything under 50% to be extremely low. However, for equity securities an extremely low correlation is frequently only found when there are substantial issues with trading volumes that may distort the statistics. Standard deviation of daily returns (dividend adjusted, measured since Jun e 2013) The standard deviation is very attractive. For WDIV, it is 0.6626%. For SPY, it is 0.6904% for the same period. SPY usually beats other ETFs in this regard, so a lower volatility level is very impressive. Because the ETF has fairly low correlation for equity investments and a low standard deviation of returns, it should do fairly well under modern portfolio theory. Liquidity looks fine Average trading volume is an issue. The average volume is running between 6,500 and 7,000 shares per day. Very low average trading volumes can result in statistics that are substantially less reliable. I will continue with my process for analyzing the ETF, but this is a red flag investors should know about. Within the time period I was looking at, there were only a few days where the change in dividend adjusted close was equal to 0.00%. When we see that the closing price did not change, it is possible that no shares were trading hands that day. If the bid and ask were moving but no shares traded hands, then a change of 0.00% understates the actual volatility and may weaken or strengthen the correlation. Therefore, investors should take the statistics with a grain of salt because they may be slightly more favorable to WDIV than they should be. Mixing it with SPY I also ran comparisons on the standard deviation of daily returns for the portfolio, assuming that the portfolio is combined with the S&P 500. For research, I assumed daily rebalancing because it dramatically simplifies the math. With a 50/50 weighting in a portfolio holding only SPY and WDIV, the standard deviation of daily returns across the entire portfolio is 0.6314%. With 80% in SPY and 20% in WDIV, the standard deviation of the portfolio would have been 0.6567%. If an investor wanted to use WDIV as a supplement to their portfolio, the standard deviation across the portfolio with 95% in SPY and 5% in WDIV would have been 0.6808%. Why I use standard deviation of daily returns I don’t believe historical returns have predictive power for future returns, but I do believe historical values for standard deviations of returns relative to other ETFs have some predictive power on future risks and correlations. Yield & Taxes The distribution yield is 4.19% and the SEC yield is 3.74%. Those are very strong yield figures for an ETF. This ETF could be worth considering for retiring investors. I like to see strong yields for retiring portfolios because I don’t want to touch the principal. By investing in ETFs I’m removing some of the human emotions, such as panic. Higher yields imply lower growth rates (without reinvestment) over the long term, but that is an acceptable trade off in my opinion. I’m not a CPA or CFP, so I’m not assessing any tax impacts. Expense Ratio The ETF is posting an expense ratio of 0.40%. I want diversification, I want stability, and I don’t want to pay for them. I view expense ratios as a very important part of the long-term return picture because I want to hold the ETF for a time period measured in decades. An expense ratio of this level is enough to concern me, but world ETFs are prone to higher expense ratios. Market to NAV The ETF is at a 0.31% premium to NAV (Net Asset Value) currently. Premiums or discounts to NAV can change very quickly so investors should check prior to putting in an order. Generally, I don’t trust deviations from NAV, and I will have a strong resistance to paying a premium to NAV to enter into a position. This ETF has relatively poor liquidity, so investors should also watch out for a large bid/ask spread. At the time of my writing, the spread was 0.25%. I’m not big on crossing that spread, so I’d be one of the people that would use a limit order and wait for the seller to come to me. Due to the fairly low trading volumes and the possibility that the order would be partially filled, I’d either have to set the order to only accept complete fills or only do the trade in accounts that trade the ETF without commissions. For comparison, the spread on SPY right now is less than 0.01%. Largest Holdings The diversification is pretty good, but not incredible. For the expense ratio, I would want more. However, the fund is supposed to be investing in high dividend yielding securities, so the investment universe for the fund may be more limited. (click to enlarge) Conclusion I’m currently screening a large volume of ETFs for my own portfolio. The portfolio I’m building is through Schwab, so I’m able to trade WDIV with no commissions. I have a strong preference for researching ETFs that are free to trade in my account, so most of my research will be on ETFs that fall under the “ETF OneSource” program. The correlation and standard deviation were great, but the potential for statistics to be misleading because of poor trading volumes leaves me concerned that the numbers may not be reliable enough. When I combine risk that the data is flawed, the moderately high expense ratios, and the bid-ask spread, I’m not really blown away by this ETF. It could be an interesting ETF to put on a watch list for the trading price to deviate from NAV and then step into a short-term position through a tax advantaged account that was not paying commissions, but I don’t think I will want to use it as my primary “international exposure” ETF. Additional disclosure: Information in this article represents the opinion of the analyst. All statements are represented as opinions, rather than facts, and should not be construed as advice to buy or sell a security. Ratings of “outperform” and “underperform” reflect the analyst’s estimation of a divergence between the market value for a security and the price that would be appropriate given the potential for risks and returns relative to other securities. The analyst does not know your particular objectives for returns or constraints upon investing. All investors are encouraged to do their own research before making any investment decision. Information is regularly obtained from Yahoo Finance, Google Finance, and SEC Database. If Yahoo, Google, or the SEC database contained faulty or old information it could be incorporated into my analysis. The analyst holds a diversified portfolio including mutual funds or index funds which may include a small long exposure to the stock.

SPDR S&P 500 ETF: SPY’s 2014 And Fourth-Quarter Performance And Seasonality

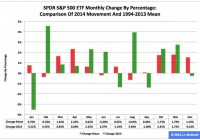
Summary The SPDR S&P 500 ETF ranked No. 1 in 2014 among the three most popular exchange-traded funds based on the S&P 1500’s constituent indexes. Most recently, the ETF’s adjusted closing daily share price last month declined to $205.54 from $206.06, a loss of -$0.52, or -0.25 percent. The last time the ETF had a negative return in the seasonally strong month of December was 2007. The SPDR S&P 500 ETF (NYSEARCA: SPY ) ranked first by return during 2014 among the three most popular ETFs based on the S&P 1500’s constituent indexes, which also encompass the SPDR S&P MidCap 400 ETF (NYSEARCA: MDY ) and the iShares Core S&P Small-Cap ETF (NYSEARCA: IJR ). SPY advanced to $205.54 from $181.15, a gain of $24.39, or 13.46 percent, in terms of adjusted closing daily share prices. Neither seasonality nor U.S Federal Reserve policy appears likely to be supportive of SPY at its current elevated level over the coming quarter. The Federal Open Market Committee announced the end of asset purchases under its third formal quantitative-easing program Oct. 29 and may announce the beginning of its next round of federal-funds-rate increases April 29. Figure 1: SPY Monthly Change, 2014 Vs. 1994-2013 Mean (click to enlarge) Source: This J.J.’s Risky Business chart is based on analyses of adjusted closing monthly share prices at Yahoo Finance . SPY behaved better in 2014 than it did over its initial 20 full years of existence based on the monthly means calculated by employing data associated with that historical time frame (Figure 1). The same data set shows the average year’s strongest quarter was the fourth, with an absolutely large positive return, and its weakest quarter was the third, with an absolutely small positive return. The last time the ETF had a negative return in the seasonally strong month of December was 2007. Figure 2: SPY Monthly Change, 2014 Vs. 1994-2013 Median (click to enlarge) Source: This J.J.’s Risky Business chart is based on analyses of adjusted closing monthly share prices at Yahoo Finance. SPY behaved worse in 2014 than it did over its initial 20 full years of existence based on the monthly medians calculated by using data associated with that historical time frame (Figure 2). The same data set shows the average year’s strongest quarter was the fourth, with an absolutely large positive return, and its weakest quarter was the third, with a relatively small positive return. Last year, the ETF performed best in the second quarter and worst in the third quarter. Disclaimer: The opinions expressed herein by the author do not constitute an investment recommendation, and they are unsuitable for employment in the making of investment decisions. The opinions expressed herein address only certain aspects of potential investment in any securities and cannot substitute for comprehensive investment analysis. The opinions expressed herein are based on an incomplete set of information, illustrative in nature, and limited in scope. In addition, the opinions expressed herein reflect the author’s best judgment as of the date of publication, and they are subject to change without notice. Now that you’ve read this, are you Bullish or Bearish on ? Bullish Bearish Sentiment on ( ) Thanks for sharing your thoughts. Why are you ? Submit & View Results Skip to results » Share this article with a colleague