Tag Archives: seeking

Which U.S. REIT ETF Has The Best Dividend Growth?
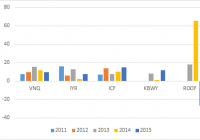
Summary REIT ETFs have attracted investor interest in the prevailing low interest rate environment. This article studies the dividend growth history of four U.S. REIT ETFs. Data are analyzed to identify the REIT ETF with the highest yield, the highest dividend growth rate and the highest “Chowder number”. Introduction The current low-interest rate environment has stimulated interest in income-generating securities such as real estate investment trusts [REITs]. Investors uncomfortable with picking individual stocks may prefer to invest in REIT ETFs. The Vanguard REIT Index Fund (NYSEARCA: VNQ ) is the largest REIT ETF, with over $25B in assets. Besides providing a relatively high yield, REITs can also grow their distributions. This article seeks to compare the dividend growth history of five U.S. REIT ETFs to determine which fund has the best dividend growth characteristics. The funds The funds chosen were VNQ, the iShares U.S. Real Estate ETF (NYSEARCA: IYR ), the iShares Cohen & Steers REIT ETF (NYSEARCA: ICF ), the KBW Premium Yield Equity REIT Portfolio (NYSEARCA: KBWY ) and the IQ US Real Estate Small Cap ETF (NYSEARCA: ROOF ). VNQ, IYR and ICF were chosen as these were the three largest REIT ETFs by assets under management [AUM]. KBWY and ROOF were chosen as these represented small/mid-cap REIT ETFs. Note that ROOF also contains some exposure to mortgage REITs [mREITs] such as New Residential Investment Corp (NYSE: NRZ ), which is currently its top holding. Details for the five REIT ETFs are shown in the table below (data from Morningstar ).   VNQ IYR ICF KBWY ROOF Yield [ttm] 3.86% 3.69% 3.20% 5.21% 5.18% Expense ratio 0.12% 0.45% 0.35% 0.35% 0.69% Inception Sep 2004 Jun 2000 Jan 2001 Dec 2010 June 2011 Assets $25.9B $4.43B $3.20B $113M $92.6M Avg Vol. 4.0M 10.2M 333K 23.7K 22.3K No. holdings 144 115 30 30 68 Avg. Cap $8.8B $11.6B $17.6B $1.8B $1.5B Annual turnover 8% 21% 8% 27% 17% Morningstar rating *** *** ** ***** ***** As can be seen from the chart above, VNQ, IYR and ICF are very large REIT funds, with billions of dollars in AUM. By comparison, KBWY and ROOF are much smaller, with around $100 million in assets. Additionally, the average market capitalization of VNQ, IYR and ICF range from $8.8B to $17.6B, while KBWY and ROOF, being mid/small-cap REIT ETFs, have much smaller average market capitalizations of $1.8B and $1.5B, respectively. In terms of expense ratio, VNQ is the cheapest at 0.12% while ROOF is the most expensive at 0.69%. Finally, KBWY has the highest yield of 5.21%, while ICF has the lowest yield of 3.20%. Dividend grow th history Only three of the funds in this study, VNQ, IYR and ICF, existed before the financial crisis in 2008-2009. Moreover, all three funds cut their distributions in the recession. Therefore, only the last six years of dividend history will be considered. Year-on-year dividend growth The following chart shows the year-on-year dividend growth for the five funds since 2011. Since only the first two quarters of dividends of 2015 have been declared thus far, the dividend growth % shown for “2015” actually represents the growth of the dividend from the previous 8th to 5th quarters (i.e. 2013 H2 + 2014 H1) to the last 4 quarters (i.e. 2014 H2 + 2015 H1). The same calculation applies to the other years in the chart. The chart above shows that the distribution history for ROOF is extremely lumpy, with a 65% increase in distribution for 2014, followed by a -27% decrease in distribution for 2015. Hence, ROOF was removed from subsequent analysis so that the differences between the other four funds can be more clearly observed. The following chart is the same as the previous one, but with ROOF removed. The chart above shows that all of the ETFs have had quite robust dividend growth over the past 5 years. 3 or 5-year average dividend growth For further comparison, I have computed the average year-on-year dividend growth percentages for each of the funds over either the past 3 or 5 years. We can see from the chart above that VNQ has had the highest dividend growth over both 3-year and 5-year periods, with average year-on-year dividend growth rates of 12.2% and 10.7%, respectively. KBWY had the lowest average 3-year dividend increase of 7.04%. Another way to compare dividend growth rates is the cumulative increase in dividend. The following chart shows the cumulative 3-year and 5-year annualized dividend growth rates of the four funds. Presenting the data in this way shows a similar story. VNQ still has the highest annualized cumulative 3-year and 5-year dividend growth rates of 12.2% and 10.7%, respectively. Chowder numbers The ” Chowder number ” is determined by adding the current yield of a security to the historical dividend growth rate. The Chowder number can be considered as a proxy for the expected total return of a security, assuming that the dividend yield of the asset stays the same. The following chart shows the Chowder numbers of the four funds using the annualized 3-year DGR. We can see from the chart above that VNQ has the highest Chowder number of 16.0%, while IYR has the lowest Chowder number of 11.20%. This suggests that going forward, VNQ might be the best investment from the total return perspective. However, one caveat is that, Chowder numbers are backward-looking and one could question whether or not dividend growth rates of REIT ETFs can be reliably extrapolated into the future. Performance The following chart shows the total return performances for VNQ, IYR and ICF over the past 5 years. The data shows that all three REIT ETFs move closely together, with VNQ leading the pack at 83.6% (12.9% annualized). The following chart shows the total return profiles for the four REIT ETFs over the past 3 years. We see that KBWY has had the best 3-year total return of 40.3% (11.9% annualized), followed by VNQ at 32.7% (9.9% annualized). IYR had the worst performance over both 3-year and 5-year periods. Conclusion This article explored the dividend growth history of three large-cap U.S. REIT ETFs, namely VNQ, IYR and ICF, as well as the mid/small-cap REIT ETF KBWY. However, the “best” REIT ETF may depend on each investor’s personal preference. Looking for the highest dividend growth rate? VNQ had the highest annualized 3-year and 5-year dividend growth rates of 12.1% and 10.7%, respectively. Looking for the highest current yield? KBWY has the highest current yield of 5.21%. Looking for the highest “Chowder number”? Using 3-year dividend growth rates, VNQ has the highest “Chowder number” of 16.0% (3.9% yield + 12.1% DGR). Looking for the best past performance? KBWY had the best total return performance (40.3%) over the past 3 years out of the four REIT ETFs, while VNQ had the best total return performance (83.6%) over the past 5 years out of VNQ, IYR and ICF. Interestingly, the “winner” of each of these categories was either VNQ or KBWY. Another reason to pick VNQ is its cheap expense ratio of 0.12%, which is the lowest out of the four funds. VNQ’s combination of 3.9% yield and 12.1% 3-year dividend growth rate makes this fund my top pick for a U.S. large-cap REIT ETF. On the other hand, KBWY provides exposure to the mid/small-cap segment of U.S. REITs, which offers diversification benefits as well as the potential for higher returns (accompanied by higher volatility). I would pick KBWY over ROOF due to KBWY’s lack of mREIT exposure as well as its more consistent dividend history. Additionally, KBWY pays monthly, which could be a plus for some investors, whereas all of the other REIT funds pay quarterly. Finally, the prevailing worries over interest rate rises has caused the REIT ETFs to drop by about 10% from their recent highs, providing more attractive entry points to income investors. VNQ Total Return Price data by YCharts Disclosure: I/we have no positions in any stocks mentioned, and no plans to initiate any positions within the next 72 hours. (More…) I wrote this article myself, and it expresses my own opinions. I am not receiving compensation for it (other than from Seeking Alpha). I have no business relationship with any company whose stock is mentioned in this article.
RSX: July Review

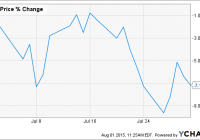
Summary The Market Vectors Russia ETF declined by 7.17% in July. The main reason for the decline were weak oil prices. The Russian economy is under pressure from declining oil prices once again. The Bank of Russia has to choose whether to fight inflation or to support the GDP growth. Weak oil prices will probably weigh on RSX also in August. The Market Vectors Russia ETF (NYSEARCA: RSX ) lost 7.17% of its value in July. The main reasons were declining oil prices and related problems of the Russian economy. Declining oil price leads to a weakening Russian Ruble and a weak Ruble leads to higher inflation. Russia needs to support its currency by hiking interest rates; however, high interest rates damage the economic growth. As a result, the Russian central bank needs to choose between lower interest rates resulting in higher GDP growth but higher inflation and higher interest rates resulting in lower inflation but lower GDP growth (stronger GDP decline respectively). The Russians have chosen GDP growth for now, as the Bank of Russia cut its key interest rate to 11%. The portfolio of RSX experienced some minor changes during July. Gazprom (OTCPK: OGZPY ) and Lukoil (OTCPK: LUKOY ) are not the biggest holdings anymore, as they were overtaken by Magnit. All of the top three holdings have weight over 7%. No new companies got amongst the top 15 holdings; however, the cumulative weight of the top 15 declined slightly, from 75.83% to 73.64%. Source: own processing, using data from vaneck.com Out of the 15 biggest holdings, only two companies experienced a positive share price development in July. Shares of Transneft and Uralkali grew by 5.3% and 3.35% respectively. The biggest decline was recorded by the telecommunication company Mobile TeleSystems (NYSE: MBT ). The company lost 16% of its value. Most of the decline occurred in the first part of the month and wasn’t related to any announcements of the company, as Q2 results will be released in August and the acquisition of NVision Group was announced in the second half of July. The oil & natural gas producers were negatively impacted by weak oil prices. Brent prices declined by 16% and WTI prices declined by more than 17% in July. Natural gas prices were relatively stable. Source: own processing, using data from Bloomberg Although the last three months were negative for RSX and the Russian share market, RSX is still 16% higher year to date. Out of the 15 biggest holdings, only shares of Yandex (NASDAQ: YNDX ) have declined since January (-24%) and the share price of Gazprom is unchanged. On the other hand, London listed shares of Surgutneftegas (OTCPK: SGTPY ) grew by 33%. Source: own processing, using data from Bloomberg The chart below shows the 10-day moving correlations between RSX and the S&P 500 and between RSX and oil prices represented by the United States Oil ETF (NYSEARCA: USO ). The correlation between RSX and the S&P 500 was high and relatively stable during July. On the other hand, the correlation between RSX and USO shows signs of instability. There was high positive correlation in the first and in the last part of the month but a huge decline in the middle of July. As a result, the oil price was declining over the whole of July but RSX managed to recover a part of the early month losses in the middle decade, only to decline even deeper during the last part of the month. Source: own processing, using data from Yahoo Finance Although RSX declined significantly in July, its volatility measured by the 10-day moving coefficient of variation was relatively stable, moving in the 2%-3% range for the better part of the month. Source: own processing, using data from Yahoo Finance Some of the more interesting news: Gazprom continues with preparations of the Nord Stream II project that should bring more natural gas to western Europe, via a gas pipeline beneath the Baltic Sea. Nord Stream II should build on the successful Nord Stream I project. The first Nord Stream gas pipeline was opened in November 2011. Nord Stream II should be completed by 2020. Meetings between Gazprom, OMV and BASF representatives, regarding the Nord Stream II project, took place in July. Gazprom has also announced that it will enter into partnership with NIPIGAZ in order to design and construct the Amur Gas Processing Plant. The Amur Gas Processing Plant should become the biggest gas processing enterprise in Russia and it should also include the world biggest helium production facility. Multicomponent gas from Gazprom’s deposits in the Irkutsk and Yakutia regions should be delivered via the Power of Siberia gas pipeline to the Amur Gas Processing Plant, where methane, ethane, propane, butane, pentane-hexane fraction and helium will be produced. Gazprom Neft (OTCQX: GZPFY ) announced completion of the first production well at Vostochno-Messoyakhskoye oil field. The field should start full-scale commercial production in late 2016, after the oil pipeline connecting the field to the Zapolyarne-Purpe pipeline system is completed. Gazprom Neft plans to expand also its downstream operations. It announced that it has secured the approval for construction of a new generation combined refining unit at its Moscow refinery. The new refining unit should boost light petroleum products production of the refinery by 40% and the refining efficiency should improve by 20%. Yandex has launched an interesting new product, a delivery services aggregator. The service is primarily designed for internet stores; however, it may be useful for some retail clients as well. According to the company, 83% of Russian internet users live outside Moscow but 47% of Russian internet store users live in Moscow. One of the reasons is that many internet stores don’t deliver goods to Russian regions, due to high costs, complicated logistics and administrative barriers. Yandex wants to support online shopping in Russian regions and of course get its share of the pie. It is possible that this is one of Yandex’s first steps on the way to expanding its activities into the online shopping industry. Rosneft (OTC: RNFTF ) keeps on cooperating with its foreign partners. On July 16 , the company announced that it completed pilot drilling at the North-Komsomolskoye field in collaboration with Statoil. Rosneft believes that the field holds at least 600 million tonnes of oil. On July 30 , Rosneft announced that it filed a joint bid with Exxon Mobil (NYSE: XOM ) for Mozambique license round. Mobile TeleSystems signed a binding agreement to acquire IT solutions provider NVision Group JSC for RUB 15 billion ($244 million). NVision is the developer and owner of TeleSystem’s billing system. This transaction should help the leading Russian telecommunications operator to improve its billing services, to offer complementary solutions to its clients and to reduce spending on in-house IT. Conclusion The Russian economy is under pressure of declining oil prices again. The low oil prices lead not only to weaker currency and lower GDP but also to lower RSX prices, as a significant part of RSX’s portfolio is created by shares of oil & natural gas producers. Although the June data indicated that the Russian economy may have reached its bottom , the recent oil price decline may prove this assumption to be incorrect. The decline of RSX should continue also in August, unless the oil prices start to recover. Editor’s Note: This article discusses one or more securities that do not trade on a major U.S. exchange. Please be aware of the risks associated with these stocks. Disclosure: I/we have no positions in any stocks mentioned, and no plans to initiate any positions within the next 72 hours. (More…) I wrote this article myself, and it expresses my own opinions. I am not receiving compensation for it (other than from Seeking Alpha). I have no business relationship with any company whose stock is mentioned in this article.

Attractive Valuations And Potential To Outperform Peers Are Highlights Of American Electric Power

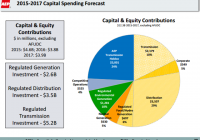
Summary Stock should trade at a 5%-10% premium to its peers’ average forward P/E. Company’s business fundamentals remain strong and efforts to strengthen regulated operations will bode well for stock price. As AEP increases regulated operations, its cash flows will become more certain, which will support dividend growth. American Electric Power (NYSE: AEP ) has strong business fundamentals and its future financial performance is expected to be solid. The stock stays an attractive investment prospect for income-seeking investors, as it offers a solid yield of 3.9% . Moreover, the company’s future growth is expected to stay strong, which will be mainly driven by its capital spending, directed at strengthening and expanding its regulated business operations. The company’s focus on regulated business operations is gaining significant traction, and it expects to achieve long-term growth of 4%-6%. Moreover, an important decision American Electric has to make in the next 3-6 months is regarding the faith of its merchant assets; either the company will sell the assets or continue to operate them. Furthermore, the stock’s current valuations are attractive. Strong Performance and Growth Catalysts American Electric has been delivering a strong financial performance, which is expected to continue in future, mainly driven by its increased focus on regulated operations. The company reported EPS of $0.88 for 2Q2015, beating consensus of $0.81. Also, rate increases and cost control initiatives positively affected American Electric’s performance for the quarter. In 2Q2015, the company secured a $123.5 million annual revenue increase and ROE of 9.75% in West Virginia, along with a $45.4 million annual revenue increase and ROE of 10.25% in Kentucky. Given the strong performance in the first half of 2015, the company increased its mid-point of 2015 EPS guidance by 2%; increased 2015 EPS guidance from $3.4-$3.6 to $3.5-$3.65 . In recent times, the company increased its focus on regulated operations, as the performance of unregulated/merchant operations has stayed weak and volatile because of low forward power prices. The company has a robust capital spending outlook, which will fuel its revenues and earnings growth in future years; American Electric plans to incur capital spending of $12.3 billion from 2015-2017. As the company has increased its focus on strengthening its regulated operations, 96% of the planned capital spending will be allocated to regulated business. Also, the company increased its 2015 capital spending guidance from $4.4 billion to $4.6 billion ; as the company continues to make progress with its cost control measures under its continuous improvement program, it freed up an additional $200 million for capital investment for 2015. The following chart shows the breakdown of the company’s planned capital spending. (click to enlarge) Source: Investors Presentation As forward power prices remain weak and volatile, utility companies in the U.S. are taking initiatives to reduce their merchant power operations. American Electric is also considering different strategic options for its 7,900MW of competitive fleet. I think that in the next 3-6 months, the company will make a decision regarding the future of its merchant assets, as currently it waits for the PJM auction results and for the pending Ohio PPA proposal. I think the best option for the company is to sell its merchant assets, as it will allow it to completely focus on regulated operations, which will improve its revenues and cash flow stability, and will augur well for the stock valuation. Moreover, I believe the company’s merchant assets sale value could range from $2 billion to $3.2 billion, depending on the outcome of the PJM auction prices, which are expected to settle by mid-August. Also, if the company chose to sell its merchant assets, it can direct the sale proceeds to increase its planned capital spending for future years, which will have a positive impact on the stock price. Other than the robust capital spending profile, the company has been making consistent efforts to improve its credit outlook. The company has successfully managed to reduce its total debt to total capitalization ratio from 57% in 2010 to 54.3% in 2Q2015. Also, the company’s qualified pension funding stands at 101% in 2Q2015, up from 96% in 1Q2015 and 97% in 2014, as displayed below in the figures. (click to enlarge) Source: Investors Presentation Valuation and Summation The stock’s current valuation stays attractive, as it is trading at a forward P/E of 15.08x , in contrast to its peers’ average forward P/E of 15.5x. Given, the company’s solid financial performance and robust capital spending profile, which will fuel its future growth, I think the stock should trade at a 5%-10% premium to its peers’ average forward P/E. Also, the company’s business fundamentals remain strong and the company’s efforts to strengthen its regulated operation will bode well for the stock price. And if the company chose to sell its merchant assets, its business risk profile will improve, as revenues and earnings will become more stable. Moreover, as the company is increasing its regulated operations, its cash flows will become more certain, which will support its dividend growth. Disclosure: I/we have no positions in any stocks mentioned, and no plans to initiate any positions within the next 72 hours. (More…) I wrote this article myself, and it expresses my own opinions. I am not receiving compensation for it (other than from Seeking Alpha). I have no business relationship with any company whose stock is mentioned in this article.