Tag Archives: seeking

SCHP: The Best TIPS Exposure Investors Can Get

Summary TIPS offer very weak yields, but SCHP is designed the right way for investors. The ETF offers a very low expense ratio, easily beating a much larger competitor. The difference in expense ratio alone should be enough to make SCHP an easy winner for an investor planning to keep part of their portfolio in TIPS. If I were retiring and really needed access to the inflation protection, I would be planning to convert part of my holdings to SCHO at the start of each year. Combining SCHP for inflation protection with SCHO to get some yield off a position that would otherwise be cash provides a nice interaction between the two bond ETFs. The Schwab U.S. TIPS ETF (NYSEARCA: SCHP ) has everything investors could hope for other than strong yields. The yield issue is not surprising; there are no good yields to be achieved on TIPS. When it comes to comparing SCHP to competitors, SCHP looks like the gold standard. As I’ve told investors, I’m avoiding TIPS because I want to see better yields. If I were a retiring investor and needed inflation protected bonds, SCHP would be the champion on the list of options. Portfolio Characteristics Investors should start with looking at things like the duration risk. Keep in mind that the since the portfolio is holding TIPS the risk of inflation over time is already built into the portfolio. Since there are many retirees that could use more stability in their portfolio, there should be very strong demand for TIPS. Honestly, I would love to have the inflation protection in my portfolio but I don’t want it bad enough to accept the yields on TIPS. Simply put, other investors want that inflation protection more than I do and they have demonstrated that desire by buying up the TIPS until the yields were incredibly low. The effective duration on the portfolio is 7.79 years which matches the average effective duration for the iShares TIPS Bond ETF (NYSEARCA: TIP ). Since the portfolio is 95.3% in TIPS with the rest in a mix of U.S. Treasury securities and a very small amount of cash, the question for each investor simply comes down: “Do you want inflation protection enough to accept the very weak yields after inflation?” There is not one correct answer. For some people it should be yes and for others it is no. This is not meant to be 100% of an investor’s portfolio but it would be a useful holding for stabilization of portfolio values. If you are buying an ETF filled with TIPS, you’re accepting having a yield that is just barely above inflation and even getting a positive yield after inflation requires taking some duration risk. The Next Question If an investor does not want to buy TIPS, there isn’t much reason to consider an ETF packed with them. For the investor that does want the TIPS in their portfolio, the next question is “Which ETF Should I Use?” In my opinion, the Schwab U.S. TIPS ETF is a clear winner in this category for many investors though some of them may not know it. The biggest competitor is the iShares TIPS Bond ETF. With the same effective duration, the actual allocation to individual security length is not identical. However, the holdings are similar enough that I am fairly confident that over the next 10 years the difference in returns between the two would come down to the expense ratio. For TIP the expense ratio is .20%. For SCHP it is only .07%. This is a case of a lower expense ratio outweighing virtually all other considerations because the portfolios being held are so similar. I don’t see any good argument for TIP to beat SCHP over the long haul when portfolios are similar and SCHP is willing to let investors keep an extra .13% of the portfolio value. Remember that these bond yields are not great; a difference of .13% on the expense ratio should make a meaningful difference over time. If SCHP is able to match TIP in gross returns, then SCHP is offering investors about another 1.3% to their portfolio value over a decade. The next factor is that investors holding Schwab portfolios are getting free trading on SCHP. If the investor wants to be able to frequently liquidate small positions and avoid holding a large amount in cash, then SCHP is offering another benefit by not charging a commission on the trade. For the retiree that wants to be able to withdraw one or two grand at a time to supplement their other income sources, saving a trading fee on the transaction will be an enormous factor. Investors paying trading fees would be saving around .45% to .9% of the value of the distribution. When we are talking about securities with a very small real yield, saving the trading costs can become material. Return Comparison SCHP has a fairly limited history, but it is playing out as I would expect so far. The distribution yields for TIP and SCHP have been almost identical (.85% for tip, .83% for SCHP). When we look at the NAV return over the last year SCHP was down 1.81% while TIP was down about 1.9% (rounded). The difference may be significantly tied to SCHP having a benefit from the lower expense ratio. The difference in price return over the period also favors SCHP by a small amount. These results are precisely what I would expect when the two ETFs hold extremely similar assets. If I Was Using SCHP If I was retiring, I would probably be holding part of my portfolio in SCHP. While the TIPS provide a return that automatically adjusts for inflation, there is still some volatility due to the duration risk on the portfolio. Therefore, I would consider pulling out money from SCHP at the start of the year. I would take the amount that I was pulling out of SCHP and reinvest it in the Schwab Short-Term U.S. Treasury ETF (NYSEARCA: SCHO ) to hold that cash until I needed to pull it out. I find SCHO to be a fairly acceptable substitute for cash in a portfolio. It does not provide inflation protection, but the very low duration works nicely. Keep in mind that this strategy would only work with free trading. Without free trading it would be better to just hold the cash rather than parking it in SCHO. My View I assume investors looking heavily at the Schwab funds probably opened a Schwab account to take advantage of those funds the same way I did. Schwab doesn’t give me anything for covering their ETFs, but I frequently choose Schwab ETFs to research because I want to know more about the ones I can trade without paying commissions. I’m adding to my portfolio several times per year and my investment mentality absolutely despises paying any unnecessary costs. Best Contender In my opinion, the best contender for the title of “Best TIPS ETF” would be the Vanguard Short-Term Inflation-Protected Securities ETF (NASDAQ: VTIP ). For investors seeking shorter duration, VTIP is a solid alternative. For investors willing to take on longer term TIPS as part of their retirement strategy, I think the SCHP portfolio’s longer duration is acceptable to seek stronger yields. If the investor had free trading on VTIP but not on SCHP, they would probably be better off with VTIP. If there were no free trades on either, I would favor SCHP for longer term allocations. Conclusion If investors want to put TIPS in their portfolio, SCHP looks like the way to do it. As long as investors are willing to accept the yield on TIPS, there is no weakness for SCHP. It easily beats other major ETFs on expense ratio while offering investors (through Schwab) the opportunity to avoid commissions on the trades. I’m not willing to accept the yield on TIPS since I expect to be working for a long time and can absorb any hits from inflation over my career. When I get to that point, hopefully yields will be stronger. Even if yields are weak, SCHP embodies all the other things I would be looking for. As for TIP, I don’t see any value in higher expense ratios. When it comes to SCHO, I’m planning to start using SCHO in my portfolio as a way to park cash while still generating a positive yield with very little risk. Disclosure: I/we have no positions in any stocks mentioned, and no plans to initiate any positions within the next 72 hours. (More…) I wrote this article myself, and it expresses my own opinions. I am not receiving compensation for it (other than from Seeking Alpha). I have no business relationship with any company whose stock is mentioned in this article. Additional disclosure: Information in this article represents the opinion of the analyst. All statements are represented as opinions, rather than facts, and should not be construed as advice to buy or sell a security. Ratings of “outperform” and “underperform” reflect the analyst’s estimation of a divergence between the market value for a security and the price that would be appropriate given the potential for risks and returns relative to other securities. The analyst does not know your particular objectives for returns or constraints upon investing. All investors are encouraged to do their own research before making any investment decision. Information is regularly obtained from Yahoo Finance, Google Finance, and SEC Database. If Yahoo, Google, or the SEC database contained faulty or old information it could be incorporated into my analysis.
Dividend ETFs: Another Canary In The Coal Mine?

Bloomberg reports that money is flowing out of dividend-focused ETFs. That’s a big change after years of inflows. Pair this up with the REIT and Utility selloff, and maybe dividend investors should start getting worried. Years ago, coal miners would bring canaries into the mines with them. Not because they wanted to have a mascot around, but because canaries were more sensitive to deadly gases. When the bird died, it was time for the humans to run for the exits. Right now, the shift taking place in income-oriented stocks could be flashing just such a warning sign. Who doesn’t love an ETF? According to Bloomberg , Vanguard Dividend Appreciation ETF (NYSEARCA: VIG ) has seen more money flow in its doors every year since it was created in 2006. Until this year, that is. Roughly $800 million has left the roughly $20 billion fund so far in 2015. And VIG isn’t alone. According to Bloomberg the dividend ETF category, with about $100 billion in assets, has seen roughly $2 billion in outflows this year. Now that’s not a huge amount of money percentage wise, but it’s a clear indication that the popularity of dividend ETFs is waning. And that’s a big deal. But what’s going on? For starters, as the Federal Reserve has talked about raising short-term interest rates, the market has already started the process. The rate on 10-year treasuries has inched up from 1.6% to 2.3% this year. VIG yields around 2.2%. Why take the risk of owning stocks if you can get the same yield from a treasury? And to add insult to injury, VIG is down roughly 2% so far this year while sibling Vanguard S&P 500 ETF (NYSEARCA: VOO ) is up about 2%. VOO yields around 2%, for comparison. So VIG is lagging the broader market and it doesn’t offer much of a yield advantage compared to the S&P 500 Index. Once again, why bother with VIG? Bigger picture But that’s not the whole picture. For example, real estate investment trusts have also fallen out of favor. Vanguard REIT Index ETF (NYSEARCA: VNQ ) is down around 4% so far this year and roughly 12% from its early year highs. And Vanguard Utilities ETF (NYSEARCA: VPU ) is down roughly 11% this year and nearly 15% from its early year highs. So dividend ETFs aren’t the only ones facing performance headwinds. Note that market watchers have commented on the asset outflows from these two funds this year, too. The take away is that sectors of the market that are associated with dividend investing aren’t the bright spots they once were. They are lagging and seeing investor outflows. And it’s worth noting that VNQ and VPU both have higher yields than the 10-year treasury. So investor flight is about more than just yield. The most likely reason for all of this bad news is investor sentiment. And that’s a potentially dangerous thing if it starts to snowball. At that point it could easily turn into an avalanche of selling. Remember Benjamin Graham’s Mr. Market isn’t sane, the prices he offers sometimes appear ridiculously high and ridiculously low. This is just another way of explaining the pendulum nature of the market, in which prices move back and forth from the extremes. Over long periods, the prices may make sense, but over short periods that’s not really the case. The next shoe to drop? There’s no way to tell, of course, what might cause what’s happening to dividend-focused investments to turn into an avalanche. However, there’s a pretty big issue coming to a head right now: the Fed and short-term rates. Some suggest that any rate hike will be small so it will have little impact on companies. And, thus, should lead to little change in stock prices. You could also argue that any hike will be driven by economic improvement, though I’d argue that the economy is hardly robust and stable right now. But these counter arguments miss the emotional impact, which is what drives stock prices over short periods of time. And it also ignores the multi-year run up in the prices of dividend-focused investments. For example, despite their recent pull backs, VIG, VNQ, and VPU are up still up roughly 70%, 55%, and 40%, respectively, over the past five years. That’s down from early year highs and you could easily argue that the declines so far this year for REITs and utilities have brought at least these two sectors back into buying territory. This thesis, however, ignores the usual market pendulum from extreme to extreme. Yes, the pendulum swings through rational, but that normally happens as it’s swinging to the other extreme. In other words, I don’t think now is the time to be aggressive. I think caution is still in order. And until the Fed actually starts raising rates, uncertainty will be your enemy. So I think the canaries are starting to choke. Perhaps it’s not time to exit the mines just yet, but I’d sure be making plans to do so if you own anything speculative. Disclosure: I/we have no positions in any stocks mentioned, and no plans to initiate any positions within the next 72 hours. (More…) I wrote this article myself, and it expresses my own opinions. I am not receiving compensation for it (other than from Seeking Alpha). I have no business relationship with any company whose stock is mentioned in this article.

Why You Should Be Looking At The Uranium Sector To Grow Your Portfolio

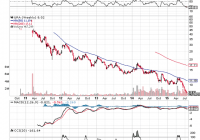
Summary Global demand for uranium is set to grow for the long term, which will cause an inevitable rise in prices. Japan is set to restart its nuclear industry with its first reactor ready to restart in August. Asian demand for energy, driven by China, S. Korea and India will demand significantly more uranium than is presently available. This is the first article of two wherein I will lay out the case that uranium prices are set to soar in the near future, perhaps as soon as the end of this year and/or into 2016. I will also provide a suggestion on an easy way to invest in the uranium sector with the potential to reap significant return on your invested capital. In my next article, I will provide investors interested in this sector with information on a number individual companies involved in the mining/production of uranium. These suggestions can be a source basis for your own further research/due diligence with the goal of providing your portfolios with a significant boost in value. The Market for Uranium According to the World Nuclear Association, the world’s nuclear power reactors currently require about 68,000 tonnes of uranium each year. The supply is provided from both mines and other sources, such as nuclear weapons stockpiles and civil stockpiles held by utilities and governments. ( source ) In 2014, the world’s total production of uranium from mining activity was 56,217 tonnes, a shortfall of 12,000 tonnes of the current requirement for world reactors. Through 2013, highly-enriched uranium from weapons stockpiles had displaced approximately 8850 tonnes of U3O8 production from mines each year, meeting about 13 to 19 percent of world reactor requirements. ( source ) Individuals who follow the uranium market are aware of the Megatons to Megawatts deal that was signed in 1993 between the USA and Russia. It was an agreement whereby the USA, “over a 20-year period, would purchase 500 tonnes of Russian ‘surplus’ high-enriched uranium (HEU) from nuclear disarmament and military stockpiles. These were to be bought by the USA for use as fuel in civil nuclear reactors. In return, the USA transferred to Russia a similar quantity of natural uranium to replace that used to downblend the HEU.” (source) This deal concluded at the end of 2013. At present, there are 437 operating nuclear power plants worldwide, and there are 60+ new plants under construction in 13 countries plus Taiwan. China has 26 operating reactors and 24 under construction . India has 21 operating reactors and 6 under construction . The USA has 5 reactors under construction and has plans to build 5 more new reactors . South Korea is planning to bring 4 reactors online by 2018 and another 8 by 2030. (for more information, see here ). Nuclear power capacity is steadily increasing on a global basis. Plant upgrading is resulting in significant capacity increases . e.g., Switzerland’s 5 plants have had their capacity increased by 13.4%, Spain’s 9 reactors have had capacity increased by 13% and numerous other countries have had capacity increased through upgrading or are in the process of doing so. Plant life extension programs are maintaining current capacity, especially in the U.S. Currently, Japan has all of its nuclear reactors shut down. As many of you reading this know, this was the result of the 2011 Fukushima accident caused by the tsunami that hit Japan March 11, 2011. However, on July 10, 2015, Kyushu Electric Power Co. announced that its Sendai Nuclear Power Unit No. 1 had completed fuel loading in preparation for its restart in August. It’s 2nd unit may be restarted as soon as September. Japan is slowly moving towards getting its nuclear industry going again. As of the end of the financial year to March 31, 2015, Japan had imported a record 7.78 trillion ($65 billion) of natural gas in order to make up for the shortfall in energy that was previously generated by the nuclear industry. Importing that much LNG has had a negative impact on Japan’s economy, making it significantly more expensive for industry to operate and squeezing profits. It has also caused an increase in household utility bills. The importing of so much LNG has also caused Japan to begin posting trade deficits, something unheard of prior to the shutting down of all of the nuclear reactors. Presently there are 25 reactors in Japan that are seeking a restart and the government, led by Prime Minister Shinzo Abe, wants to start as many as possible “to meet the nation’s energy needs and grow the economy.” ( source ) The restarting of Japan’s nuclear reactors should have a positive impact on the price of uranium. The psychological barrier to investing in the sector that shutting down its reactors caused will be removed and this should be bullish for the price. The restarts will also boost the confidence of investors in the industry as a whole and the long-term prospects for the nuclear power industry. Although Germany is planning to decommission all of its nuclear power plants by 2020, there is a real fear by taxpayers in the country that they will have to foot the bill for the increase in prices that are going to be an inevitable cost of shuttering the nuclear power industry. So, will Germany reverse course and eventually go back to using nuclear energy or power generation? Time will tell, but even the country does get completely out of nuclear power generation, it really won’t have any negative impact on the inevitable rise in prices ahead. This is because of the Asian move towards nuclear energy to meet the massive need for power in that area of the world, home to 4.47 billion people. In East through to South Asia, there are currently 123 operating nuclear power reactors, 41 under construction and firm plans to build 92 more, while many more are proposed. The greatest growth in nuclear power generation is expected in China, South Korea and India. ( source ) How To Invest In The Sector Aside from investing in individual uranium mining and processing companies, some of which I will highlight in my next article on this subject, one way to invest in this sector is through the Global X Uranium ETF (NYSEARCA: URA ). See the chart below. (click to enlarge) URA tracks the Solactive Global Uranium Index and both the index and the ETF include companies involved in the exploration, mining, and harnessing of uranium. Some of the top holdings include Cameco Corp. (NYSE: CCJ ), Uranium One (TSE-UUU), and Hathor Exploration (TSX-HAT). You can see from the chart above that the ETF has seen its price decimated by the melt down (pun intended) in the sector since 2011 and the fall in the price of uranium, which currently sits at a spot price of Nevertheless, for contrarions, this presents a great time to consider investing some funds in this space, especially as the uranium price, currently sitting at approximately $36/pound, is bound to begin rising in response to the inevitable demand/supply imbalance created by the need for more and more affordable and clean energy sources, especially in Asia. Disclosure: I/we have no positions in any stocks mentioned, but may initiate a long position in URA over the next 72 hours. (More…) I wrote this article myself, and it expresses my own opinions. I am not receiving compensation for it (other than from Seeking Alpha). I have no business relationship with any company whose stock is mentioned in this article.