Tag Archives: nysearcaroof

What Is In Store For REIT ETFs Ahead?

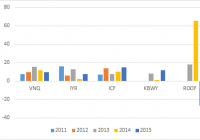
As the timeline of the first rate hike after a decade is approaching this month, interest-rate sensitive sectors like REITs are falling out of investors’ favor. REIT ETFs emerged a winner last year thanks to widespread volatility, but are mostly in the red this year as the Fed liftoff is looming large (read: Top ETF Stories of November ). Notably, REITs own and operate income-producing real estate. They are required to distribute at least 90% of their taxable income to shareholders annually in the form of dividends and can in turn deduct the payout from their corporate taxable income. The basic idea is that a rise in interest rates will undoubtedly lead to a high borrowing cost on which the REITs are highly dependent. Moreover, high-dividend yielding stocks like REITs usually become less attractive when treasury yields rise. At this point of time, we can say that a policy tightening is unavoidable in the mid-December Fed meeting; at least the Fed officials and economic progress are giving such cues. Minor lack in some economic readings wouldn’t come in the way of the Fed decision. Recent comments from the Fed have certainly influenced Treasury bond yields too. With the yields increasing, several investors may now be turning away from REITs. But do REITs deserve such negligence? Are investors overreacting? Let’s find out. Short-Term Yields Rising Faster Investors should note that the 10-year benchmark Treasury bond yields jumped 21 basis points to 2.33% (as of December 3, 2015) since the start of the year, a relatively slower ascent than what we saw in 2013 due to Fed taper talks. It was the short end of the yield curve that was hit hard (read: Short-Term Bond Yields Rising: Timely ETF Bets ). Yields on the six-month U.S. Treasury bonds surged 34 bps to 0.45% (as of the same date) since the start of the year as the Fed hikes the benchmark rate. In such a situation, investors can very well bet on the income-producing securities like REITs as long-term Treasury yields are not rising as fast as feared. Moreover, the Fed repeatedly asserted that it will take a slow stance in policy tightening giving yet another reason not to worry much over REIT securities. As investors continue to search for income, REITs can give them some market-beating yields which will in turn make up for capital losses also, if there is any. Economic Strength to Bode Well The negative correlation between rising rates and REITs, in all cases, is a common misconception. Notably, when rates rise on the back of a pickup in the economy, REITs actually outperform. As per reit.com , “in the 16 periods since 1995 when interest rates rose significantly, Equity REITs generated positive returns in 12.” The REITs business is associated with basic consumer requirements like apartments, shopping malls, warehouses, lodging and dining, office, hospital among others. In a growing economy, people consume and spend more in malls for discretionary purchases. An uptick in the U.S. housing sector is now a known fact; job growth will push office REITs and hospital REITs are always a stable area, irrespective of the market condition. Now, as the Fed is viewing the economy as strong enough to gobble up the first rate hike, there should not be much downside risks in REIT stocks and ETFs. After all, the job market is healing and inflation is inching up. REITs stand to gain with growth in occupancy and hike in rents. The consistent increase in rent will also help REITs to keep pace with inflation. Overvaluation Concerns However, there are hurdles in the path too as REIT ETFs are not all cheap investments. The popular Vanguard REIT Index ETF (NYSEARCA: VNQ ) trades at a P/E ((ttm)) of 34 times against the SPDR S&P 500 Trust ETF’s (NYSEARCA: SPY ) P/E of 19. So, just as the Fed pulls the trigger, a correction, probably a short-lived one, is expected in the REIT space. Below highlight three REIT ETFs that were relatively less hit by rate worries in the last one-month frame and proved sturdier in the pack. iShares Residential Real Estate Capped ETF (NYSEARCA: REZ ) The $319-million fund is heavy on Residential REITs and Health Care REITs. The 37-stocks fund charges 48 bps in fees. However, the fund has concentration risks as its first two holdings take about 23% of the basket. The fund yields 3.25% and was down just 0.02% in the last one-month frame (as of December 3, 2015). IQ U.S. Real Estate Small Cap ETF (NYSEARCA: ROOF ) The fund holds 60 small-cap stocks in the basket. It is an unpopular choice with about $86 million in assets. The ETF charges 69 bps in fees per year from investors. The product is less concentrated across its top 10 securities as no stock accounts for more than 3.50% of the basket. ROOF was down 2.5% in the last one month and yielded 5.68% as of December 3, 2015. The fund currently has a Zacks ETF Rank #3 (Hold) with a Medium risk outlook. iShares Cohen & Steers REIT ETF (NYSEARCA: ICF ) This $3.57-billion fund holds 30 securities. Industry-wide, retail, residential, specialized, office and health care REITs get double-digit weights. The fund charges 35 bps a year in fees. The fund lost about 2.9% in the last one month and yielded 3.22% as of December 3, 2015. Link to the original post on Zacks.com

Which U.S. REIT ETF Has The Best Dividend Growth?

Summary REIT ETFs have attracted investor interest in the prevailing low interest rate environment. This article studies the dividend growth history of four U.S. REIT ETFs. Data are analyzed to identify the REIT ETF with the highest yield, the highest dividend growth rate and the highest “Chowder number”. Introduction The current low-interest rate environment has stimulated interest in income-generating securities such as real estate investment trusts [REITs]. Investors uncomfortable with picking individual stocks may prefer to invest in REIT ETFs. The Vanguard REIT Index Fund (NYSEARCA: VNQ ) is the largest REIT ETF, with over $25B in assets. Besides providing a relatively high yield, REITs can also grow their distributions. This article seeks to compare the dividend growth history of five U.S. REIT ETFs to determine which fund has the best dividend growth characteristics. The funds The funds chosen were VNQ, the iShares U.S. Real Estate ETF (NYSEARCA: IYR ), the iShares Cohen & Steers REIT ETF (NYSEARCA: ICF ), the KBW Premium Yield Equity REIT Portfolio (NYSEARCA: KBWY ) and the IQ US Real Estate Small Cap ETF (NYSEARCA: ROOF ). VNQ, IYR and ICF were chosen as these were the three largest REIT ETFs by assets under management [AUM]. KBWY and ROOF were chosen as these represented small/mid-cap REIT ETFs. Note that ROOF also contains some exposure to mortgage REITs [mREITs] such as New Residential Investment Corp (NYSE: NRZ ), which is currently its top holding. Details for the five REIT ETFs are shown in the table below (data from Morningstar ).   VNQ IYR ICF KBWY ROOF Yield [ttm] 3.86% 3.69% 3.20% 5.21% 5.18% Expense ratio 0.12% 0.45% 0.35% 0.35% 0.69% Inception Sep 2004 Jun 2000 Jan 2001 Dec 2010 June 2011 Assets $25.9B $4.43B $3.20B $113M $92.6M Avg Vol. 4.0M 10.2M 333K 23.7K 22.3K No. holdings 144 115 30 30 68 Avg. Cap $8.8B $11.6B $17.6B $1.8B $1.5B Annual turnover 8% 21% 8% 27% 17% Morningstar rating *** *** ** ***** ***** As can be seen from the chart above, VNQ, IYR and ICF are very large REIT funds, with billions of dollars in AUM. By comparison, KBWY and ROOF are much smaller, with around $100 million in assets. Additionally, the average market capitalization of VNQ, IYR and ICF range from $8.8B to $17.6B, while KBWY and ROOF, being mid/small-cap REIT ETFs, have much smaller average market capitalizations of $1.8B and $1.5B, respectively. In terms of expense ratio, VNQ is the cheapest at 0.12% while ROOF is the most expensive at 0.69%. Finally, KBWY has the highest yield of 5.21%, while ICF has the lowest yield of 3.20%. Dividend grow th history Only three of the funds in this study, VNQ, IYR and ICF, existed before the financial crisis in 2008-2009. Moreover, all three funds cut their distributions in the recession. Therefore, only the last six years of dividend history will be considered. Year-on-year dividend growth The following chart shows the year-on-year dividend growth for the five funds since 2011. Since only the first two quarters of dividends of 2015 have been declared thus far, the dividend growth % shown for “2015” actually represents the growth of the dividend from the previous 8th to 5th quarters (i.e. 2013 H2 + 2014 H1) to the last 4 quarters (i.e. 2014 H2 + 2015 H1). The same calculation applies to the other years in the chart. The chart above shows that the distribution history for ROOF is extremely lumpy, with a 65% increase in distribution for 2014, followed by a -27% decrease in distribution for 2015. Hence, ROOF was removed from subsequent analysis so that the differences between the other four funds can be more clearly observed. The following chart is the same as the previous one, but with ROOF removed. The chart above shows that all of the ETFs have had quite robust dividend growth over the past 5 years. 3 or 5-year average dividend growth For further comparison, I have computed the average year-on-year dividend growth percentages for each of the funds over either the past 3 or 5 years. We can see from the chart above that VNQ has had the highest dividend growth over both 3-year and 5-year periods, with average year-on-year dividend growth rates of 12.2% and 10.7%, respectively. KBWY had the lowest average 3-year dividend increase of 7.04%. Another way to compare dividend growth rates is the cumulative increase in dividend. The following chart shows the cumulative 3-year and 5-year annualized dividend growth rates of the four funds. Presenting the data in this way shows a similar story. VNQ still has the highest annualized cumulative 3-year and 5-year dividend growth rates of 12.2% and 10.7%, respectively. Chowder numbers The ” Chowder number ” is determined by adding the current yield of a security to the historical dividend growth rate. The Chowder number can be considered as a proxy for the expected total return of a security, assuming that the dividend yield of the asset stays the same. The following chart shows the Chowder numbers of the four funds using the annualized 3-year DGR. We can see from the chart above that VNQ has the highest Chowder number of 16.0%, while IYR has the lowest Chowder number of 11.20%. This suggests that going forward, VNQ might be the best investment from the total return perspective. However, one caveat is that, Chowder numbers are backward-looking and one could question whether or not dividend growth rates of REIT ETFs can be reliably extrapolated into the future. Performance The following chart shows the total return performances for VNQ, IYR and ICF over the past 5 years. The data shows that all three REIT ETFs move closely together, with VNQ leading the pack at 83.6% (12.9% annualized). The following chart shows the total return profiles for the four REIT ETFs over the past 3 years. We see that KBWY has had the best 3-year total return of 40.3% (11.9% annualized), followed by VNQ at 32.7% (9.9% annualized). IYR had the worst performance over both 3-year and 5-year periods. Conclusion This article explored the dividend growth history of three large-cap U.S. REIT ETFs, namely VNQ, IYR and ICF, as well as the mid/small-cap REIT ETF KBWY. However, the “best” REIT ETF may depend on each investor’s personal preference. Looking for the highest dividend growth rate? VNQ had the highest annualized 3-year and 5-year dividend growth rates of 12.1% and 10.7%, respectively. Looking for the highest current yield? KBWY has the highest current yield of 5.21%. Looking for the highest “Chowder number”? Using 3-year dividend growth rates, VNQ has the highest “Chowder number” of 16.0% (3.9% yield + 12.1% DGR). Looking for the best past performance? KBWY had the best total return performance (40.3%) over the past 3 years out of the four REIT ETFs, while VNQ had the best total return performance (83.6%) over the past 5 years out of VNQ, IYR and ICF. Interestingly, the “winner” of each of these categories was either VNQ or KBWY. Another reason to pick VNQ is its cheap expense ratio of 0.12%, which is the lowest out of the four funds. VNQ’s combination of 3.9% yield and 12.1% 3-year dividend growth rate makes this fund my top pick for a U.S. large-cap REIT ETF. On the other hand, KBWY provides exposure to the mid/small-cap segment of U.S. REITs, which offers diversification benefits as well as the potential for higher returns (accompanied by higher volatility). I would pick KBWY over ROOF due to KBWY’s lack of mREIT exposure as well as its more consistent dividend history. Additionally, KBWY pays monthly, which could be a plus for some investors, whereas all of the other REIT funds pay quarterly. Finally, the prevailing worries over interest rate rises has caused the REIT ETFs to drop by about 10% from their recent highs, providing more attractive entry points to income investors. VNQ Total Return Price data by YCharts Disclosure: I/we have no positions in any stocks mentioned, and no plans to initiate any positions within the next 72 hours. (More…) I wrote this article myself, and it expresses my own opinions. I am not receiving compensation for it (other than from Seeking Alpha). I have no business relationship with any company whose stock is mentioned in this article.