Tag Archives: seeking-alpha

Vanguard Portfolio Part 5: 4th Quarter Results

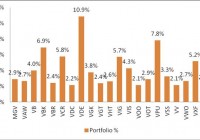
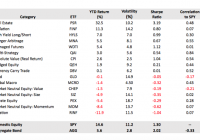
My portfolio gained 2.24% points in the fourth quarter. My portfolio’s end of year return was 9.88%. My portfolio beat 2 of 3 selected indices. The fourth quarter and year has ended for my all Vanguard portfolio . The quarterly and year to date reviews are below. Performance: My portfolio in the fourth quarter rebounded from the third quarter . It increased 2.24 percentage points. All three benchmarks performed better this quarter and all out performed my portfolio. The EOY return on my portfolio increased to 9.88%. I am still outperforming two of the indexes. I did so well the first half of the year that even though I slid in the second half I still did well. The table below shows the fourth quarter and YTD returns. 4th Qtr. % change EOY Return Vanguard 2.24% 9.88% S&P 500 5.79% 12.39% DJIA 6.6% 8.4% Russell 2000 10.99% 3.41% Below are the returns of all my positions at the end of the year. I took a piece of advice from a comment in my third quarter paper. I summed up the values of the same ETF in each different account. The table should be easier to read this time. Ticker % Chg Annualized Yield Vanguard Mega Cap Value ETF (NYSEARCA: MGV ) 13.13% 13.94% Vanguard Materials ETF (NYSEARCA: VAW ) 4.13% 6.60% Vanguard Small Cap ETF (NYSEARCA: VB ) 7.22% 10.04% Vanguard Small Cap Growth ETF (NYSEARCA: VBK ) 3.49% 4.57% Vanguard Small Cap Value ETF (NYSEARCA: VBR ) 7.37% 9.23% Vanguard Consumer Discretionary ETF (NYSEARCA: VCR ) 13.90% 15.14% Vanguard Consumer Staples ETF (NYSEARCA: VDC ) 14.24% 15.51% Vanguard Energy ETF (NYSEARCA: VDE ) -6.66% -8.22% Vanguard FTSE Developed Markets ETF (NYSEARCA: VEA ) -6.54% -12.18% Vanguard FTSE All-World ex-US ETF (NYSEARCA: VEU ) -5.71% -10.68% Vanguard Financials ETF (NYSEARCA: VFH ) 13.31% 17.03% Vanguard FTSE Europe ETF (NYSEARCA: VGK ) -4.72% -8.87% Vanguard Information Technology ETF (NYSEARCA: VGT ) 10.76% 56.76% Vanguard Health Care ETF (NYSEARCA: VHT ) 13.89% 18.99% Vanguard Dividend Appreciation (NYSEARCA: VIG ) 11.56% 12.58% Vanguard Industrials ETF (NYSEARCA: VIS ) 8.19% 10.34% Vanguard REIT Index ETF (NYSEARCA: VNQ ) 15.42% 8.44% Vanguard Mid Cap ETF (NYSEARCA: VO ) 9.45% 13.45% Vanguard Mid-Cap Value ETF (NYSEARCA: VOE ) 0.00% 65.22% Vanguard S&P 500 ETF (NYSEARCA: VOO ) 12.61% 18.06% Vanguard Mid-Cap Growth ETF (NYSEARCA: VOT ) 12.51% 17.34% Vanguard FTSE Pacific ETF (NYSEARCA: VPL ) 0.70% 0.84% Vanguard Utilities ETF (NYSEARCA: VPU ) 11.91% 18.33% Vanguard FTSE All-World ex-US Small-Cap ETF (NYSEARCA: VSS ) -4.07% -7.68% Vanguard Total World Stock ETF (NYSEARCA: VT ) -0.17% -0.32% Vanguard Value ETF (NYSEARCA: VTV ) 15.44% 16.83% Vanguard Growth ETF (NYSEARCA: VUG ) 12.48% 17.88% Vanguard Large Cap ETF (NYSEARCA: VV ) 6.49% 31.41% Vanguard FTSE Emerging Markets ETF (NYSEARCA: VWO ) -2.56% -2.77% Vanguard Emerging Markets Government Bond Index ETF (NASDAQ: VWOB ) -0.50% -0.58% Vanguard Extended Market Index ETF (NYSEARCA: VXF ) 6.96% 15.16% Vanguard Total International Stock ETF (NASDAQ: VXUS ) -4.43% -5.31% Vanguard High Dividend Yield ETF (NYSEARCA: VYM ) 11.67% 14.91% Vanguard Telecom Services ETF (NYSEARCA: VOX ) 4.56% 195.86% In the third quarter VTV was the only position that was over 10%. Now 14 ETFs have over a 10% return for the year. VNQ and VDC did the best this year. All the ETFs that are geared towards international stocks are in the red. It seems that every other country is still struggling. The energy sector is struggling too. VDE had the worst return and I lost over 6%. The number of positions that were negative from the third quarter to the end of the year went from 11 to 9. Looking at all my positions one can see why I didn’t do as well as the S&P. The S&P tracks the top 500 companies and is a good representation of the U.S. market. I have a lot of international positions and I already mentioned how all those were negative. Taking out those I would have had a return of over 12.5%. However, I am invested in those because I believe in diversification. Transactions: The fourth quarter was busy for trading. I had 72 trades which was more than the number of trades I had in the third quarter. Most of the trades were in the first few weeks of October as the market was dropping. I like to buy when everyone else sells and hold when everyone buys. I had a few major sells. I finished selling off all my positions in VCLT, BLV, and EDV. Interest rates were still low and when the market dropped in early October government bonds increased. I sold them and used most of profits to invest in VDE. The number of investments remained the same from the third quarter at 34. The chart below shows the ETFs that had more than a 2% weight. This is much different than the weights in the third quarter. The weights are more diverse. 20 ETFs are over 2%. VCLT was replaced by VDE as the highest weight. (click to enlarge) End of year comments: From looking back at my third quarter comments I stuck to my plan in the fourth quarter. When the market dipped at the start of October I was in buying mode and added to all my positions. From the middle of October to the end of the year the market went higher and I stopped trading and let the returns ride. I think overall my strategy worked out. This was the second best thing than to trading individual stocks. Most of my ETFs were positive. There were a few losers, but that’s how it goes. I was at the higher end of my 7-10% prediction. I didn’t expect the S&P to do a lot better, I thought I was closely tied to the market and that my portfolio should have tracked it almost perfectly. At the midpoint of the year my return was already up 9.77%. That means I was flat for the rest of the year. I expected much more at that point. 9.88% still beat 2 of the 3 benchmarks so I can’t be too disappointed. I think I am in a good position for the future. I think my positions in VDE and in the international ETFs will turn around next year. Since my portfolio did well there is nothing from deterring me from continuing the same strategy into next year. Now that you’ve read this, are you Bullish or Bearish on ? Bullish Bearish Sentiment on ( ) Thanks for sharing your thoughts. Why are you ? Submit & View Results Skip to results » Share this article with a colleague

Recap: The Best And The Worst In Alternative Investment ETFs

John Bogle, founder of the Vanguard fund family, has cautioned investors for many years about playing cute with their investment portfolios. “Don’t look for a needle in the haystack,” says Saint Jack, “just buy the haystack.” With that, Bogle inveighs against stock-picking and advocates the use of index funds. Why try to beat the market, in his view, since you can’t do it consistently? Not surprisingly, many investment advisors rail against Bogle’s notion. Some, particularly those running endowments and foundations, are duty bound to seek equity-like returns without the concentrated risk of stock investments. Which brings us to alternative investments. Mixing “alts” into a portfolio can, in the best of circumstances, enhance returns and diversify risk. This year, though, alts have had an especially tough row to hoe. Domestic equities, measured by the performance of S&P 500 SPDR ETF (NYSEARCA: SPY ) , gained 15 percent in 2014 with an annualized volatility of 11 percent. As stand-alone investments, only one alt category outperformed the domestic stock market. (click to enlarge) Alts, of course, aren’t meant to be stand-alones; they’re destined, for most investors, to be portfolio adjuncts. Real estate was the standout of the year, offering a one-two combination punch of outsized gain and low volatility. The PowerShares Active US Real Estate ETF (NYSEARCA: PSR ) more than doubled SPY’s return with a smaller standard deviation. All this with a middling correlation to the broad equity market. If you were shopping for negative correlation to equities this year, the shelves were rather bare. Only two ETFs – the SPDR Gold Shares Trust (NYSEARCA: GLD ) and the QuantShares US Market Neutral Value ETF (NYSEARCA: CHEP ) – cranked out negative coefficients against SPY. And the price for this? Negative returns, though arguably you could say GLD had a breakeven year. If you base your diversification success on the Sharpe ratio – a gauge of risk-adjusted returns – this year’s runner-up alt bets were managed futures and absolute value, epitomized by the WisdomTree Managed Futures Strategy ETF (NYSEARCA: WDTI ) and the HedgeIQ Real Return ETF , respectively. The derby for 2015’s best and worst kicks off today. Stay tuned for ongoing updates.

Oil And Gas ETFs As Seen By Market-Makers

Summary Mostly there’s not very attractive candidates for new capital commitment in any current competition, in comparison with top alternatives. But they may be about even with the equity investment population overall. Better single-stock choices are to be outlined in our third survey, of the broad oilpatch, coming next. The oil commodity price decline scares nearly all investors ETF risk protection from a basket of similar eggs may not be all it’s cracked up to be. When we run our Intelligent Behavior Analysis of ETF price range forecasts derived from the hedging actions of market-makers [MMs], the resulting outlook is not very attractive. Here is a picture of how the current upside price prospects compare with what price drawdowns actually transpired following similar prior forecasts. (used with permission) The cast of characters: [1] Direxion Daily Energy Bear 3x ETF (NYSEARCA: ERY ) [2] SPDR S&P Oil & Gas Exploration & Production ETF (NYSEARCA: XOP ) [3] iShares US Energy ETF (NYSEARCA: IYE ) [4] First Trust ISE-Revere Natural Gas ETF (NYSEARCA: FCG ) [4] iShares US Oil & Gas Exploration & Production ETF (NYSEARCA: IEO ) [5] Direxion Daily Energy Bull 3x ETF (NYSEARCA: ERX ) [6] SPDR S&P 500 ETF (NYSEARCA: SPY ) [7] Vanguard Energy ETF (NYSEARCA: VDE ) [8] ProShares Ultra Oil & Gas 2x ETF (NYSEARCA: DIG ) [9] Energy Select Sector SPDR ETF (NYSEARCA: XLE ) [10] iShares US Oil Equipment & Services ETF (NYSEARCA: IEZ ) [11] SPDR S&P Oil & Gas Equipment & Services ETF (NYSEARCA: XES ) [12] ProShares Ultra Short Oil & Gas 2x ETF (NYSEARCA: DUG ) [13] Market Vectors Oil Services ETF (NYSEARCA: OIH ) The non-standard ETFs are ERX and DIG – leveraged long; ERY and DUG – leveraged short; SPY – a broad market tracker for background comparison. All the others are ETFs focused on the oilpatch in general or various parts thereof. The map places each ETF at the intersection of its forecast upside (the green horizontal scale) and its average actual worst-case price drawdowns following prior forecasts like today’s (on the red vertical scale). Attractive investments typically are found down in the green area. Each ETF is the product of its current market price and the MMs’ impression of what their clients (who have the money muscle to move markets) are likely to do in coming weeks and months. Multiple daily phone conversations with them about desired portfolio changes, plus their own world-wide instantaneous information gathering systems and support staffs attempt to keep the MMs from being victimized by their clients. For further protection, the MMs turn to their skills in using the derivative markets and the arbitrage opportunities they provide in the form of price change insurances. The block trade desks of the MM firms are the usual buyers of the insurance, MM proprietary trade desks are the usual sellers. That makes this typically a well-informed, knowledgeable, experienced activity, bounded by the willingness of the clients to transact trade orders at prices that contain the costs of the price insurances. Those negotiations make possible the MM commitments of firm capital to balance that part of volume orders the market otherwise would not accommodate. Implicit in the hedging are expectations of likely possible price change limits, both up and down. Here are details on these ETFs and a comparison with population averages in the format of our daily Top Ten ranking: (click to enlarge) The blue-line average of these 13 ETFs does not compare very favorably with the most favorable 20 stock and ETF current competitors. In particular, please note columns (5) and (6). The prior price drawdowns of nearly -10% are nearly double those of the best-ranked 20. While the ETF upside promise of about +16% beats the 20’s +12%, it appears to be a hollow enticement, since prior forecasts like today’s – in (9) – averaged only +2.5%. The 20 actually bested their current promise. Further, the prior performances of the 20 best were profitable 12 out of each 13 times (92% win odds) compared to only 2 out of 3 (12 of 18 or 67%) for these ETFs. Even the market, in its tracker ETF of SPY did much better at being profitable 85 out of each 100 prior like forecasts. Specific ETF Potentials The two inverse (short-structured) ETFs, ERY [1] and DUG [12] are the least attractive, indicating that their prices already contain ample recognition of likely continued weakness in oil and gas commodity prices. Their prior forecasts at today’s level of balance between upside and downside prospects have produced negative net returns when subjected to our TERMD (Time-Efficient Risk Management Discipline) of portfolio management. All others were at least slightly net profitable. The most attractive energy ETF performers in this set, ERX [5] and DIG [8], fall far short of the 20 best equity competitor averages in terms of payoff performance (9) and win odds (8). When compared to the market average SPY, they have had better price payoffs, and approach its win odds. Conclusion This continues to be a poor time (and prices) for investment in energy ETFs. That does not need to be the case for specific stocks that can separate themselves from their surroundings because of special company, geography, or competitive advantages. Or merely more advantageous stock pricing at the present. All that will be examined in our next review of the market-makers price range outlooks for specific energy stocks in groups as outlined by energy expert Richard Zeits.