Frontrunning Yield Shares High Income ETF YYY And ETRACS Monthly Pay 2xLeveraged Closed-End Fund ETN CEFL: Could You Have Profited?
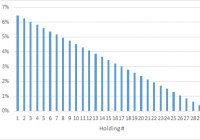
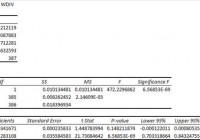
Summary ISE High Income Index, the index for YYY and CEFL, is rebalanced annually on the last trading day of each year. CEFs that were to be added saw heavy buying pressure before the rebalancing date, while those to be removed saw heavy selling pressure. Could an investor have profited by frontrunning YYY? I invite the astute readership of Seeking Alpha to join the case. Introduction In a previous article , we looked at how end-of-year selling in Eaton Vance Tax-Managed Global Buy-Write Opportunities Fund (NYSE: ETW ) pushed the discount of this closed-end fund [CEF] to levels not seen in the past 18 months. The article suggested buying ETW to lock in a high 10.6% yield, as well as to grasp the potential opportunity for capital appreciation if the -10.3% discount narrows back to its historical averages. We also saw that in the last four trading days of 2014, over 956K shares of ETW changed hands, greatly exceeding its average daily volume of 400K. The final day’s volume of 1.6M was the highest in all of 2014. In the comment stream of that article, some posters suggested that end-of-year tax issues may have caused the high-volume selling, while others suggested that institutional selling may have been the culprit. In this article, we explore the possibility that clever traders may have been frontrunning the annual rebalancing event of the ISE High Income Index [YLDA]. YLDA is the index tracked by Yield Shares High Income (NYSEARCA: YYY ), a CEF “fund-of-funds”, and ETRACS Monthly Pay 2xLeveraged Closed-End Fund ETN (NYSEARCA: CEFL ), the 2X leveraged version of YYY. Did the “smart money” profit by frontrunning the index rebalancing event? ISE High Income Index Methodology The steps to construct the ISE High Income Index are shown below (source: ISE ). 1. Restrict selection universe to closed-end funds with market cap > $500M and six month daily average volume > $1M. 2. Rank each fund by the following three criteria: i. Fund yield (descending) ii. Fund share price Premium / Discount to Net Asset Value (ascending) iii. Fund Average Daily Value (ADV) of shares traded (descending) 3. Calculate an overall rank for each fund by taking the weighted average of the three ranks with the following weightings: yield@50%, premium/discount@25%, average daily value@25%. 4. Select the 30 funds with the highest overall rank. 5. Adjust each component’s weighting to a multiple of the weighting of the smallest component using an equation that results in the following distribution: 6. If a component weight is greater than 4.25% then that weight is adjusted to be no more than 4.25%. 7. Perform further re-weighting of the constituents by using calculations related to average daily value (too complicated to reproduce here) to arrive at the following distribution (YYY constituents data obtained from YieldShares website on 1/2/2015; the composition represents the freshly rebalanced index): Basically, this index ranks CEFs by a composite score of yield, discount, and liquidity, with yield being the most important factor. The fund holdings are then weighted by their rank as well by a further liquidity measure. The index is rebalanced annually. According to YYY’s prospectus (emphasis mine): Index constituents are reviewed for eligibility and the Index is reconstituted and rebalanced on an annual basis. The review is conducted in December of each year and constituent changes are made after the close of the last trading day in December and effective at the opening of the next trading day . Most importantly, ISE gave notice on 12/24/2014 on the proposed changes it planned to make on the index one week later. How many YYY, CEFL or other CEF investors noticed that memo? I know I didn’t! Changes in YYY The first table shows the constituents of YYY on 12/31/2014 (source: Google cache of YieldShares website). Excluding cash, there were 28 holdings. Name Ticker Shares Market Value % YYY Market Value % of YYY Net Assets BLACKROCK RESOURCE&COMMOD BCX 457,298 $4,440,363.58 5.55% 5.52% EATON VANCE TAX-MGD DV EQ ETY 338,576 $3,781,893.92 4.73% 4.70% EATON VANCE TM BUY-WRT OP ETV 262,972 $3,697,386.32 4.62% 4.60% ALPINE TOTAL DYNAMIC DIVD AOD 432,317 $3,670,371.33 4.59% 4.57% EATON VANCE TM GL DIV EQ EXG 368,974 $3,501,563.26 4.38% 4.36% EATON VANCE RISK-MGD DIV ETJ 327,699 $3,493,271.34 4.37% 4.35% GABELLI EQUITY TRUST GAB 537,828 $3,479,747.16 4.35% 4.33% PIMCO HIGH INCOME FUND PHK 308,487 $3,470,478.75 4.34% 4.32% VOYA GLBL EQTY DIVD FUND IGD 416,842 $3,468,125.44 4.34% 4.31% NUVEEN GLOBAL HIGH INCOME JGH 199,476 $3,440,961.00 4.30% 4.28% EATON VANCE TM GLB BUY-WR ETW 304,469 $3,355,248.38 4.19% 4.17% MFS INTERMED INCOME TRUST MIN 700,908 $3,350,340.24 4.19% 4.17% ALLIANZGI NFJ DIV INT&PRM NFJ 205,033 $3,280,528.00 4.10% 4.08% BLACKROCK GLOBAL OPPORTUN BOE 245,574 $3,224,386.62 4.03% 4.01% BLACKROCK INTL GROWTH&INC BGY 451,944 $3,046,102.56 3.81% 3.79% BLACKROCK MULTI-SECTR INC BIT 178,736 $2,997,402.72 3.75% 3.73% PIMCO CORP & INCOME OPP PTY 185,985 $2,957,161.50 3.70% 3.68% GAMCO GLBL GOLD NAT RES GGN 409,741 $2,868,187.00 3.59% 3.57% BLACKROCK CREDIT ALLOC IN BTZ 215,699 $2,786,831.08 3.48% 3.47% FLAHERTY & CRUMRINE PFD FFC 138,794 $2,644,025.70 3.31% 3.29% WESTERN ASSET EMG MKT DBT ESD 156,073 $2,459,710.48 3.08% 3.06% COHEN & STEERS LTD DURAT LDP 102,413 $2,320,678.58 2.90% 2.89% EATON VANCE LIMITED DURAT EVV 138,478 $1,955,309.36 2.44% 2.43% BLACKROCK ENHANCED CAP&IN CII 126,348 $1,765,081.56 2.21% 2.20% ABERDEEN ASIA-PAC INCOME FAX 234,414 $1,300,997.70 1.63% 1.62% BLACKROCK ENHANCED EQ DIV BDJ 147,788 $1,200,038.56 1.50% 1.49% PIMCO INCOME STRATEGY PFN 98,785 $969,080.85 1.21% 1.21% WELLS FARGO ADV MULTISECT ERC 56,798 $774,156.74 0.97% 0.96% CASH 303,655 $303,654.55 0.38% 0.38% Total $80,003,084.28 100.00% 99.52% The second table shows the constituents of YYY one day later, on 1/2/2015 (source: YieldShares ). Excluding cash and negative holdings (see below), there were 31 holdings. Name Ticker Shares Market Value % YYY Market Value % of YYY Net Assets DOUBLELINE INCOME SOLUTIO DSL 176,655 $3,522,500.70 4.46% 4.59% MFS CHARTER INCOME TRUST MCR 387,732 $3,520,606.56 4.46% 4.59% PRUDENTIAL GL SH DUR HI Y GHY 221,101 $3,513,294.89 4.45% 4.58% PIMCO DYNAMIC CREDIT INCO PCI 169,312 $3,496,292.80 4.43% 4.56% FIRST TRUST INTERMEDIATE FPF 156,318 $3,492,144.12 4.42% 4.55% BLACKROCK CORPORATE HIGH HYT 308,047 $3,487,092.04 4.42% 4.55% MORGAN STANLEY EMERGING M EDD 335,183 $3,482,551.37 4.41% 4.54% EATON VANCE LIMITED DURAT EVV 243,912 $3,434,280.96 4.35% 4.48% GAMCO GLBL GOLD NAT RES GGN 491,906 $3,418,746.70 4.33% 4.46% CLOUGH GLBL OPPORTUNITIES GLO 266,654 $3,402,505.04 4.31% 4.44% EATON VANCE TM GL DIV EQ EXG 346,605 $3,303,145.65 4.18% 4.31% ALPINE TOTAL DYNAMIC DIVD AOD 381,618 $3,289,547.16 4.17% 4.29% VOYA GLBL EQTY DIVD FUND IGD 394,980 $3,290,183.40 4.17% 4.29% ALPINE GLOBAL PREMIER PRO AWP 461,150 $3,287,999.50 4.16% 4.29% WESTERN ASSET EMG MKT DBT ESD 206,718 $3,257,875.68 4.13% 4.25% EATON VANCE TAX-MGD DV EQ ETY 268,080 $3,007,857.60 3.81% 3.92% ABERDEEN ASIA-PAC INCOME FAX 517,670 $2,873,068.50 3.64% 3.74% BLACKROCK INTL GROWTH&INC BGY 426,276 $2,864,574.72 3.63% 3.73% PRUDENTIAL SHORT DURATION ISD 165,461 $2,703,632.74 3.42% 3.52% CALAMOS GLOBAL DYNAMIC IN CHW 279,141 $2,501,103.36 3.17% 3.26% MFS MULTIMARKET INC TRUST MMT 359,981 $2,336,276.69 2.96% 3.05% BLACKSTONE/GSO STRATEGIC BGB 133,423 $2,164,121.06 2.74% 2.82% ALLIANZGI CONVERTIBLE & I NCV 216,654 $2,025,714.90 2.57% 2.64% WESTERN ASSET HIGH INC FD HIX 220,376 $1,826,917.04 2.31% 2.38% BLACKROCK MULTI-SECTR INC BIT 89,249 $1,501,168.18 1.90% 1.96% BLACKROCK ENHANCED EQ DIV BDJ 141,872 $1,152,000.64 1.46% 1.50% ALLIANZGI CONV & INCOME I NCZ 127,464 $1,119,133.92 1.42% 1.46% WELLS FARGO ADVANTAGE INC EAD 125,552 $1,111,135.20 1.41% 1.45% NUVEEN PFD INC OPP FD JPC 98,355 $927,487.65 1.17% 1.21% INVESCO DYNAMIC CREDIT OP VTA 64,502 $764,993.72 0.97% 1.00% WELLS FARGO ADV MULTISECT ERC 38,175 $524,906.25 0.67% 0.68% CASH 377,203 $377,202.63 0.48% 0.49% PIMCO INCOME STRATEGY PFN -3,993 -$40,089.72 -0.05% -0.05% BLACKROCK ENHANCED CAP&IN CII -5,082 -$72,113.58 -0.09% -0.09% COHEN & STEERS LTD DURAT LDP -4,158 -$95,717.16 -0.12% -0.13% FLAHERTY & CRUMRINE PFD FFC -5,682 -$111,764.94 -0.14% -0.15% BLACKROCK CREDIT ALLOC IN BTZ -8,790 -$114,621.60 -0.15% -0.15% PIMCO CORP & INCOME OPP PTY -7,470 -$122,059.80 -0.16% -0.16% BLACKROCK GLOBAL OPPORTUN BOE -9,939 -$130,896.63 -0.17% -0.17% ALLIANZGI NFJ DIV INT&PRM NFJ -8,328 -$134,413.92 -0.17% -0.18% EATON VANCE TM GLB BUY-WR ETW -12,261 -$136,955.37 -0.17% -0.18% NUVEEN GLOBAL HIGH INCOME JGH -7,938 -$138,200.58 -0.18% -0.18% MFS INTERMED INCOME TRUST MIN -28,623 -$139,680.24 -0.18% -0.18% GABELLI EQUITY TRUST GAB -21,747 -$141,138.03 -0.18% -0.18% EATON VANCE RISK-MGD DIV ETJ -13,164 -$142,697.76 -0.18% -0.19% PIMCO HIGH INCOME FUND PHK -12,408 -$142,940.16 -0.18% -0.19% EATON VANCE TM BUY-WRT OP ETV -10,500 -$149,520.00 -0.19% -0.20% BLACKROCK RESOURCE&COMMOD BCX -18,411 -$180,611.91 -0.23% -0.24% Total $78,986,639.97 100.00% 102 .95% Notice also that the holdings of YYY on 1/2/2015 include several funds with small but negative numbers of shares. My guess is that the negative holdings are just a residual effect of the rebalancing mechanism that just took place. I then manually calculated the change in percentage of net assets of the individual constituents of YYY between 12/31/2014 and 1/2/2015. The following table shows the results ranked in decreasing order of change in percentage. In other words, CEFs newly added to the index appear at the top while CEFs removed from the index appear at the bottom. % on 12/31/2014 % on 1/2/2015 Difference DSL 0.00% 4.59% 4.59% MCR 0.00% 4.59% 4.59% GHY 0.00% 4.58% 4.58% PCI 0.00% 4.56% 4.56% FPF 0.00% 4.55% 4.55% HYT 0.00% 4.55% 4.55% EDD 0.00% 4.54% 4.54% GLO 0.00% 4.44% 4.44% AWP 0.00% 4.29% 4.29% ISD 0.00% 3.52% 3.52% CHW 0.00% 3.26% 3.26% MMT 0.00% 3.05% 3.05% BGB 0.00% 2.82% 2.82% NCV 0.00% 2.64% 2.64% HIX 0.00% 2.38% 2.38% FAX 1.62% 3.74% 2.13% EVV 2.43% 4.48% 2.04% EAD 0.00% 1.45% 1.45% JPC 0.00% 1.21% 1.21% ESD 3.06% 4.25% 1.19% VTA 0.00% 1.00% 1.00% GGN 3.57% 4.46% 0.89% BDJ 1.49% 1.50% 0.01% IGD 4.31% 4.29% -0.03% EXG 4.36% 4.31% -0.05% BGY 3.79% 3.73% -0.06% ERC 0.96% 0.68% -0.28% AOD 4.57% 4.29% -0.28% ETY 4.70% 3.92% -0.78% PFN 1.21% -0.05% -1.26% BIT 3.73% 1.96% -1.77% CII 2.20% -0.09% -2.29% LDP 2.89% -0.13% -3.01% FFC 3.29% -0.15% -3.44% BTZ 3.47% -0.15% -3.62% PTY 3.68% -0.16% -3.84% BOE 4.01% -0.17% -4.18% NFJ 4.08% -0.18% -4.26% MIN 4.17% -0.18% -4.35% ETW 4.17% -0.18% -4.35% JGH 4.28% -0.18% -4.46% PHK 4.32% -0.19% -4.50% GAB 4.33% -0.18% -4.51% ETJ 4.35% -0.19% -4.53% ETV 4.60% -0.20% -4.79% BCX 5.52% -0.24% -5.76% Those changes in percentages are also shown graphically: Unusual volume before rebalancing Let’s have a look at the volume of the CEFs a few days before the rebalancing date to see if we can observe any unusual activity. We first shortlist the 10 CEFs that had the highest increase in allocation upon YYY rebalancing. Those 10 CEFs had increases ranging from 3.52% for ISD to 4.59% for DSL. The following graph shows the daily volume of those 10 CEFs for the 3 months leading up to 12/31/2014, which is the day before rebalancing took place. DSL Volume data by YCharts Note the unusual spike in volume on the final few trading days of the year. We next select the 8 CEFs that had allocation changes of less than 1% upon YYY rebalancing. Those 8 funds had % changes ranging from -0.78% in ETY to +0.89% for GGN. The following graph shows the daily volume of those 8 CEFs for the 3 months leading up to 12/31/2014. GGN Volume data by YCharts We can observe no signs of unusual trading volume for those 8 CEFs. We finally select the 10 CEFs that had the largest decreases in allocation upon YYY rebalancing. Those 10 CEFs had decreases ranging from -4.18% for BOE to -5.76% for BCX. The following graph shows the daily volume of those 10 CEFs for the 3 months leading up to 12/31/2014. BOE Volume data by YCharts Again, notice the unusual volume increase in the last few trading days of 2014. In summary, funds that recorded the largest increases or decreases in allocation upon rebalancing saw unusually high volume several days before the actual rebalancing were to take place. On the other hand, funds that did not change much upon YYY rebalancing did not exhibit unusual spikes in volume. Price changes before rebalancing We now turn to the price changes of the constituents on the final few trading days of the year and on the following day (i.e. the rebalancing date). The following charts show the 5-day price changes (up to 1/2/2015) of the 10 CEFs with the largest increases in allocation upon YYY rebalancing (data from Seeking Alpha ). (click to enlarge) If you look closely at the charts, you may see a spike in the price of the funds at “2” (see GLO and ISD for the most obvious examples). Interestingly, according to Yahoo Finance this spike actually takes place at the close of 12/31/2014, even though the prospectus for YYY states that the rebalancing is conducted after the close of the last trading day in December. We can also see that the prices of those funds generally rose over the final few trading days of the year. All 10 of the CEFs ended up higher over the last 5 days. The graph below shows the price of those 10 CEFs from 12/26/2014 to 1/2/2015. If you had bought those funds on the first day, you would have made an average of 2.96% in one week. DSL Price data by YCharts How about the funds that saw the largest decrease in allocation upon YYY rebalancing? The following charts show the 5-day price changes (up to 1/2/2015) of the 10 CEFs with the largest decreases in allocation upon YYY rebalancing (data from Seeking Alpha ). (click to enlarge) Again, if you look closely, see if you can spot the downward spike in price at an x-axis value of “2”. Again, Yahoo Finance reports that the price spike takes place at the close of 12/31/2014, while YYY’s prospectus states that the rebalancing takes place after close of the last trading day of the year. We can also see that the prices of those funds generally declined over the final few trading days of the year. All 10 of the CEFs ended up lower over the last five days. The graph below shows the price of those 10 CEFs from 12/26/2014 to 1/2/2015. If you had bought those funds on the first day, you would have lost an average of -3.38% in one week. BOE Price data by YCharts How about those 8 CEFs with less than 1% change in allocation upon YYY rebalancing? First, the individual charts (data from Seeking Alpha ): (click to enlarge) We see more of a mixed bag here. Of those 8 CEFs, 2 ended up higher and 6 ended up lower over the last five days. The graph below shows the price of those 8 CEFs from 12/26/2014 to 1/2/2015. If you had bought those funds on the first day, you would have lost an average of -0.94% in one week. GGN Price data by YCharts To summarize, if on 12/26/2014 you had bought the 10 CEFs that underwent the largest increases in allocation upon YYY rebalancing five days later, all 10 would have gone up and you would have made 2.96% in a week. On the other hand, if on 12/26/2014 you had bought the 10 CEFs that underwent the largest decreases in allocation upon YYY rebalancing five days later, all 10 would have gone down and you would have lost -3.38% in a week. Both the 2.96% gain and -3.38% loss were statistically significant. Meanwhile, if on 12/26/2014 you bought 8 CEFs whose allocations would change by less than 1% upon YYY rebalancing five days later, 2 ended up higher and 6 ended up lower, with an average loss of -0.94% in a week. Due to the wide variation in the returns of the 8 CEFs, the -0.94% loss was not statistically significant. Discussion The evidence presented in this article suggests that clever traders got the memo on which CEFs would be added or removed from YYY, as indicated by the unusual increase in trading volumes of those funds over the last few trading days of the year. In comparison, CEFs that did not undergo major changes in allocation did not exhibit unusual trading activity. Furthermore, the data showed that the CEFs that underwent an increase in allocation upon rebalancing saw a rise in price over the last few trading days of the year, indicating significant buying pressure, while the CEFs that underwent a decrease in allocation upon rebalancing saw a steady in price, indicating significant selling pressure. Investors who bought the 10 CEFs with the largest increases in allocation would have been rewarded with a 2.96% in one week, while those who bought the 10 CEFs with the largest decreases in allocation would have lost -3.38% in one week. That’s a pretty decent profit for only one week of holding time. There still remains one unanswered question: why did YYY fall 1.25% (and CEFL 2.96%) on 1/2/2015, a day where both stocks (SPY: -0.05%; ACWI: -0.24%) and bonds (IEF: 0.51%; JNK: 0.18%) held relatively steady? Moreover, PowerShares CEF Income Composite Portfolio ETF (NYSEARCA: PCEF ), a CEF fund-of-funds that tracks a different index, rose +0.21%. The total assets of YYY on 12/31/2014 was $80.00B, while the total assets of YYY on 1/2/2015 was $78.99B, a decrease of 1.26%. This decrease is consistent with the 1.25% decline of YYY on 1/2/2015. My slightly wild theory is this: the price spikes at the close of 12/31/2014 was a consequence of YYY rebalancing. YYY had to buy the constituents to be added and sell the constituents to be removed. However, the smart money knew this, and so raised the ask price of those CEFs, forcing YYY to buy at a higher price. Similarly, the smart money lowered the bid price of the funds that were to be removed, forcing YYY to sell at a lower price. Let’s take another look at the 10 CEFs that saw the highest increases in allocation (the first set of Seeking Alpha charts). At the close of 1/2/2015, 7 of the 10 CEFs did not manage to recover to the level of the price spike on 12/31/2014. In other words, if YYY indeed was forced to buy in on the upwards price spikes, it would be sitting on losses at the close of 1/2/2015 because it purchased its holdings at a significantly higher price. Similarly, if YYY was forced to sell on the downward price spikes, it would have raised less cash than it “should” have been entitled to. This all sounds like a conspiracy theory, but if true, it means that investors in YYY and CEFL (myself included) got slightly hosed by the actions of these frontrunners. However, I can’t really blame anyone since the proposed changes were made public five days before the rebalancing date. My understanding is that front-running regular ETFs usually isn’t possible because any discrepancies in the share prices of the constituents will get quickly arbitraged away. However, when the underlying constituents are CEFs, which can individually show premium or discount values, then this arbitrage mechanism might not be completely operative, allowing price differences to persist. Not to mention the fact that the liquidity of certain CEFs may be less than ideal during this holiday period. I now invite the astute readership of Seeking Alpha to join in the case. I would be very interested to hear from anyone who has any ideas or explanations regarding the following questions. Were traders frontrunning the index? What caused the price spikes of the CEFs at the close of 12/31/2014? How do you explain the 1.25% decline of YYY on 1/2/2015? Why does the holdings data for YYY on 1/2/2015 show negative share counts? Would the retail investor be able to profit from these price movements next year?