Scalper1 News
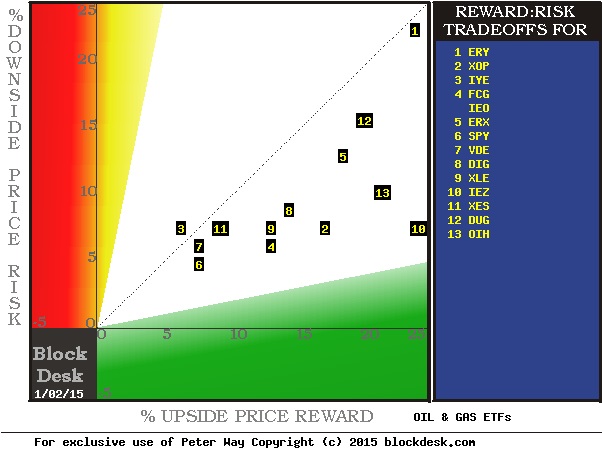
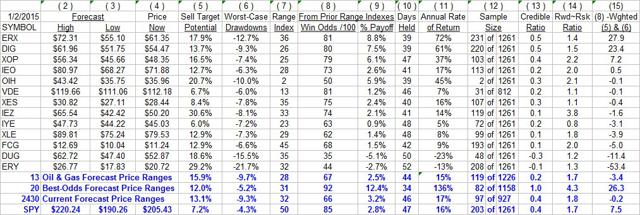 Summary Mostly there’s not very attractive candidates for new capital commitment in any current competition, in comparison with top alternatives. But they may be about even with the equity investment population overall. Better single-stock choices are to be outlined in our third survey, of the broad oilpatch, coming next. The oil commodity price decline scares nearly all investors ETF risk protection from a basket of similar eggs may not be all it’s cracked up to be. When we run our Intelligent Behavior Analysis of ETF price range forecasts derived from the hedging actions of market-makers [MMs], the resulting outlook is not very attractive. Here is a picture of how the current upside price prospects compare with what price drawdowns actually transpired following similar prior forecasts. (used with permission) The cast of characters: [1] Direxion Daily Energy Bear 3x ETF (NYSEARCA: ERY ) [2] SPDR S&P Oil & Gas Exploration & Production ETF (NYSEARCA: XOP ) [3] iShares US Energy ETF (NYSEARCA: IYE ) [4] First Trust ISE-Revere Natural Gas ETF (NYSEARCA: FCG ) [4] iShares US Oil & Gas Exploration & Production ETF (NYSEARCA: IEO ) [5] Direxion Daily Energy Bull 3x ETF (NYSEARCA: ERX ) [6] SPDR S&P 500 ETF (NYSEARCA: SPY ) [7] Vanguard Energy ETF (NYSEARCA: VDE ) [8] ProShares Ultra Oil & Gas 2x ETF (NYSEARCA: DIG ) [9] Energy Select Sector SPDR ETF (NYSEARCA: XLE ) [10] iShares US Oil Equipment & Services ETF (NYSEARCA: IEZ ) [11] SPDR S&P Oil & Gas Equipment & Services ETF (NYSEARCA: XES ) [12] ProShares Ultra Short Oil & Gas 2x ETF (NYSEARCA: DUG ) [13] Market Vectors Oil Services ETF (NYSEARCA: OIH ) The non-standard ETFs are ERX and DIG – leveraged long; ERY and DUG – leveraged short; SPY – a broad market tracker for background comparison. All the others are ETFs focused on the oilpatch in general or various parts thereof. The map places each ETF at the intersection of its forecast upside (the green horizontal scale) and its average actual worst-case price drawdowns following prior forecasts like today’s (on the red vertical scale). Attractive investments typically are found down in the green area. Each ETF is the product of its current market price and the MMs’ impression of what their clients (who have the money muscle to move markets) are likely to do in coming weeks and months. Multiple daily phone conversations with them about desired portfolio changes, plus their own world-wide instantaneous information gathering systems and support staffs attempt to keep the MMs from being victimized by their clients. For further protection, the MMs turn to their skills in using the derivative markets and the arbitrage opportunities they provide in the form of price change insurances. The block trade desks of the MM firms are the usual buyers of the insurance, MM proprietary trade desks are the usual sellers. That makes this typically a well-informed, knowledgeable, experienced activity, bounded by the willingness of the clients to transact trade orders at prices that contain the costs of the price insurances. Those negotiations make possible the MM commitments of firm capital to balance that part of volume orders the market otherwise would not accommodate. Implicit in the hedging are expectations of likely possible price change limits, both up and down. Here are details on these ETFs and a comparison with population averages in the format of our daily Top Ten ranking: (click to enlarge) The blue-line average of these 13 ETFs does not compare very favorably with the most favorable 20 stock and ETF current competitors. In particular, please note columns (5) and (6). The prior price drawdowns of nearly -10% are nearly double those of the best-ranked 20. While the ETF upside promise of about +16% beats the 20’s +12%, it appears to be a hollow enticement, since prior forecasts like today’s – in (9) – averaged only +2.5%. The 20 actually bested their current promise. Further, the prior performances of the 20 best were profitable 12 out of each 13 times (92% win odds) compared to only 2 out of 3 (12 of 18 or 67%) for these ETFs. Even the market, in its tracker ETF of SPY did much better at being profitable 85 out of each 100 prior like forecasts. Specific ETF Potentials The two inverse (short-structured) ETFs, ERY [1] and DUG [12] are the least attractive, indicating that their prices already contain ample recognition of likely continued weakness in oil and gas commodity prices. Their prior forecasts at today’s level of balance between upside and downside prospects have produced negative net returns when subjected to our TERMD (Time-Efficient Risk Management Discipline) of portfolio management. All others were at least slightly net profitable. The most attractive energy ETF performers in this set, ERX [5] and DIG [8], fall far short of the 20 best equity competitor averages in terms of payoff performance (9) and win odds (8). When compared to the market average SPY, they have had better price payoffs, and approach its win odds. Conclusion This continues to be a poor time (and prices) for investment in energy ETFs. That does not need to be the case for specific stocks that can separate themselves from their surroundings because of special company, geography, or competitive advantages. Or merely more advantageous stock pricing at the present. All that will be examined in our next review of the market-makers price range outlooks for specific energy stocks in groups as outlined by energy expert Richard Zeits. Scalper1 News
Scalper1 News