Tag Archives: seeking-alpha

Materials ETFs Mauled By Falling Oil Prices

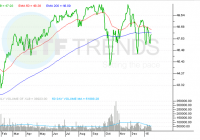
Summary Energy prices are falling. Low oil prices are weighing on the materials sector. Materials are experiencing lower activity on energy fallout. Oil’s slide has identified some winners at the sector level, namely consumer-related shares, but beyond the energy sector, there are some losers as well. Those losers include the materials sector, which was already scuffling heading into 2015. Last year, the Materials Select Sector SPDR ETF (NYSEARCA: XLB ) rose just 7.2%, including paid dividends. XLB’s 2014 showing was 630 basis points worse than the S&P 500, and enough to make the fund the second-worst of the nine sector SPDR ETFs, behind only the Energy Select Sector SPDR ETF (NYSEARCA: XLE ) . To this point in the new year, only three of the nine sector SPDRs have traded higher. XLB is not a member of that trio. In theory, materials stocks should be winner in a low energy price environment, because lower oil and gas prices reduce input costs for energy-intensive materials producers and chemicals manufacturers. In reality, that has not been the case. While the materials sector’s earnings warnings have not yet reached alarming heights, it is clear oil’s plunge is taking a toll on the sector. Of XLB’s top 10 holdings, a group that combines to make up about two-thirds of the ETF’s weight, only three have traded higher to start 2015. “The investment markets reflect these winners and losers in the economy. Consumer driven sectors of the market have performed quite well. The energy and commodity sectors of the market have not. Between oil stocks, the materials sector, and industrial and utility names in commodity-related businesses, roughly 20 percent of the S&P 500 is a loser with falling oil prices.” – Jones & Associates LyondellBasell Industries (NYSE: LYB ), one of XLB’s top 10 holdings, said that in the fourth quarter low oil prices will damp its margins. That after the company helped materials ETFs perform well in the first half of 2014 on the back of rising crude prices . A recent Morgan Stanley report highlighted PPG Industries (NYSE: PPG ), a top 10 holding in XLB, as one materials name that could endure lower oil prices, but the bank also identified Eastman Chemical (NYSE: EMN ), LyondellBasell and Dow Chemical as potentially challenged by lower oil prices. Those stocks combine to make up over 16% of XLB’s weight. XLB’s five-year correlation to The United States Oil ETF (NYSEARCA: USO ) is over 59%, according to State Street data . Materials Select Sector SPDR ETF (click to enlarge)

Why Indexing And ‘Smart Beta’ Are So Popular

By Jack Vogel, Ph.D. Asset Manager Contracts and Equilibrium Prices Abstract: We study the joint determination of fund managers’ contracts and equilibrium asset prices. Because of agency frictions, investors make managers’ fees more sensitive to performance and benchmark performance against a market index. This makes managers unwilling to deviate from the index and exacerbates price distortions. Because trading against overvaluation exposes managers to greater risk of deviating from the index than trading against undervaluation, agency frictions bias the aggregate market upwards. They can also generate a negative relationship between risk and return because they raise the volatility of overvalued assets. Socially optimal contracts provide steeper performance incentives and cause larger pricing distortions than privately optimal contracts. Core Idea: This is a theoretical paper, so proceed with caution! However, the paper does a good job discussing the Principal/Agent Problem . Briefly stated, the “principal/agent problem” relates to how the interests of agents, who act on behalf of principals, can conflict with those of the principals. In investing, when an asset manager’s performance (or fees) is measured or benchmarked relative to an index, the potential friction (of losing fees and possibly their job) causes the manager to track closer to the index. Here is a quote from the paper: Benchmarking, however, only incentivizes the manager to take risk that correlates closely with the index, and discourages deviations from that benchmark. Thus, the manager becomes less willing to overweight assets in low demand by buy-and-hold investors, and to underweight assets in high demand. The former assets become more undervalued in equilibrium, and the latter assets become more overvalued. Within this theoretical framework, how are asset prices affected? In the graphs below, the blue solid line represents assets in large supply, and the red dashed line assets in small supply. Notice in the graph, that the more expensive asset has lower supply, while the less expensive asset has higher supply! Not surprisingly, the expected return is inverted, where the asset with less supply and is more expensive has lower expected returns, while the asset with high supply and lower price has higher expected returns. Additionally, these assets with higher (lower) supply have lower (higher) volatility. See the paper for details on why this may be so. Note, however, that if an expensive (overvalued) asset with higher volatility has a positive shock to expected cash flows, it would account for a larger portion of market movement. For this reason, managers are reluctant not to hold it, and instead will buy it, since they fear that failing to buy it may cause them to deviate from the benchmark. The main conclusion is that in this theoretical world, asset managers tend to hug the index, as their fees are tied to the index, and thus they are loath to do things that might cause them to depart from it. In the real world, this makes sense as well. Imagine the following two investment strategies that an institutional money manger must pick from: With 98% certainty, you are going to beat the index by 5% over the next 10 years. The other 2% of the time, you will lose to the index by 1%. However, you know that 3 of the years you may lose by as much as 8%! So while the long run expected returns are quite high, the return path to get there is very noisy and volatile. With 50% certainty, you are going to beat the index by 1% over the next 10 years. The other 50% of the time, you will lose to the index by 0.50%. In any given year, you will be +/- 0.25% relative to the index. Here, the long run expected returns are comparatively lower, but the return path is stable. Now, from a mathematical and economist perspective, there is an easy solution — calculate the expected value. Expected Value = beat index by (0.98%)(5%) + (2%)(-1%) = beat index by 4.88% Expected Value = beat index by (0.50%)(1%) + (50%)(-0.5%) = beat index by 0.50 % Any economist would pick option 1! It’s a slam dunk. However, the asset manager knows that picking option 1 is risky to him as an agent, as he might lose his job if the principal (owner of money) loses faith in his strategy. Ever wonder why smart beta products run rampant in the marketplace? It’s because smart beta has low tracking error versus the index. Although expected returns are modest, the manager will remain withing hailing distance of the benchmark, and a principal can’t complain too much about that, right? Unfortunately, this may not necessarily be in the principal’s best interests. Original Post

A New Income Oriented Multi-Asset ETF Hits The Market

Income investing has been on a tear since last year thanks to the plunge in bond yields. Global growth worries, a relentless slide in oil prices, QE talks in the Euro zone, a ‘patient’ Fed and stepped-up stimulus in Japan resulted in easy money policies across the developed world and in turn dragged yields down. This spurred many issuers to put out new products in this income space, greatly enhancing the number of options at investors’ disposal in this key market segment. Many may think that the income investing space is stuffed, leaving no scope for a new theme to perk up investors’ mood. To prove this group wrong, Master Shares recently released a pass-through ETF with an alternative focus, this time on income. The ETF trades under the name of the Master Income ETF (NYSEARCA: HIPS ). Let’s dig deeper. HIPS in Focus The fund looks to track the TFMS HIPS 300 Index, focusing on 300 securities with a pass-through structure. This is done by looking at securities from the sectors including closed-end fund (CEFs), mREITs, commercial/residential/diversified REITs, business development companies and MLPs. The fund charges 87 bps in fees. How Could it Fit in a Portfolio? The fund does look to be a great way to play the alternative securities space in an ETF form, while its yield will be tough to beat. The current period of low interest rates makes this income paying ETF quite attractive. Investors should note that high income paying securities play a defensive role in a portfolio and help to reduce overall volatility in uncertain times. The pass-through structure is basically created to avoid the effects of double taxation. The product could also be an interesting choice for those reluctant to invest in the regular ways of income investing like junk bonds or high-dividend equities. The constituents of the portfolio are un-correlated in nature and bear less relationship with the typical bond and stock exchanges. Thus, barring the income lure, the product should go a long way in hedging marketing volatility in the portfolio. ETF Competition Since the high yield space sees tough competition due to relentless launches over the last two years, the issuer gave this product an unusual packaging to set it apart from the regular pack. Still, some high income products with a focus on alternative securities are presently operating in the market. These include the likes of the ETRACS Diversified High Income ETN (NYSEARCA: DVHI ), the iShares Morningstar Multi-Asset Income Index ETF (BATS: IYLD ), the SPDR Income Allocation ETF (NYSEARCA: INKM ), the Guggenheim Multi-Asset Income ETF (NYSEARCA: CVY ), the First Trust Multi-Asset Diversified Income Index ETF (NASDAQ: MDIV ) and the YieldShares High Income ETF (NYSEARCA: YYY ). Expense ratio wise, the newly launched ETF looks reasonable as other products charge in the range of 60 bps to 165 bps a year. This is especially true given the product’s focus on pass-through entities and wide coverage from CEFs to MLPs. However, to be a winner in a long-distance race, the issuer should dedicatedly focus on the income part of the ETF. Notably, YYY holds the status of the highest yielding product in the space of diversified ETFs, having yielded about 9.6% as of January 13, 2015. To live up to investors’ expectations, the fund should offer something around that high benchmark, otherwise it could be somewhat prohibitive to asset accumulation, at least to those who are highly yield-starved.