Tag Archives: seeking-alpha

Reaves Utility Income Fund: Dividend Stability In Good Markets And Bad

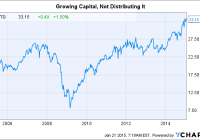
Like so many CEFs, UTG lost ground during the last recession… but it managed to maintain and subsequently grow its distribution. Impressively, UTG’s distribution has, so far, never contained any return of capital. Although leverage is a concern, UTG has proven it’s a worthwhile utility option. One of the most frequent concerns about closed-end funds, or CEFs, is return of capital distributions. So it should come as a pleasant surprise that Reaves Utility Income Fund (NYSEMKT: UTG ) has never had to use return of capital, despite a notable, though not excessive, yield of around 5.5%. And the dividend has never been cut, either. If you are looking for a long-term utility fund that provides steady, monthly income, Reaves should be on your watch list. Core sector fund Reaves Utility Income Fund , obviously, focuses on the utility sector. The portfolio is largely comprised of utilities (electric, gas, water, and telecom), with some small exposure to railways, media, and real estate investment trusts. However, even in these non-utility areas, the focus is on utility-like or focused businesses. Its media exposure, for example, is largely comprised of cable companies. And the real estate exposure is in the cell phone tower space. Railways, meanwhile, are core suppliers to the utility industry. So Reaves provides fairly broad exposure to the utility space, but not exclusive exposure to the electricity industry. Management uses both qualitative and quantitative approaches as it looks for investments. For example, it conducts interviews with potential investments, their competitors, and suppliers. This helps create both an outlook for a company and for the broader industry. That, in turn, feeds into models that Reaves builds to help get a handle on a company’s, “…robustness under differing business scenarios…” Another key factor is an evaluation of a company’s management, examining such things as the competence of corporate leaders, their track record, and their alignment with shareholders’ interests. And while all of the above effort may point to a great company, Reaves also takes a stern look at valuation, considering measures such as Price to Earnings, Price to Book, and Price to Cash Flow. It also examines, “…historical absolute and relative dividend…” yields and such technical factors as short interest and liquidity. Reaves also has the leeway to use leverage. According to the Closed-End Fund Association , leverage recently stood at nearly 30%. It can go as high as 38%. Leverage can be a double-edged sword, enhancing performance in good markets and exacerbating losses in bad ones. It’s an issue to keep an eye on, with at least the expectation of increased volatility if you own the CEF. Leverage is also one of the reasons that the fund’s expense ratio is a bit high at around 1.7%. Although the CEF does not have a stated dividend mandate, it pays monthly and has elected to keep a level distribution. That distribution is at the discretion of the board of directors. Impressively, the dividend has been increased seven times since the fund started paying dividends in April of 2004. It has never been cut, not even during the deep 2007 to 2009 recession. And, perhaps even more impressive, it has never included return of capital. That’s an important feature for investors who are concerned that distributions are just giving them back their principle and eating away at the fund’s net asset value over time. That’s not the case at Reaves Utility Income Fund and while the yield is likely less then you might get elsewhere, that seems a decent trade-off if you want to avoid return of capital. Performance With this as background, how has Reaves Utility Income Fund actually performed? Over the tailing 10 years through year end 2014, Reaves posted an annualized return of 12.8% based on market price and 11.5% based on net asset value, or NAV, according to Morningstar. For comparison, Vanguard Utilities ETF returned an annualized 9.5% over the same span. That’s a pretty compelling record, to the say the least. That said, it’s worth noting that 2008 was a terrible year for Reaves Utility Income on both an absolute and relative basis. For example, while Vanguard Utilities ETF fell around 28%, Reaves’ share price fell nearly 50%, with an NAV decline of roughly 43%. Clearly, leverage made things worse in 2008. That said, in 2009, Reaves’ NAV advanced 35% with a market price recovery of 75%. Vanguard Utilities ETF was up a far less impressive 11.5% or so that year. That’s the happier edge of the leverage sword. And while the fund doesn’t always beat the broader utility group, it has done so often enough and with large enough margins that it has put up a very compelling long-term record. UTG data by YCharts And while Morningstar’s trailing performance data include distributions because they are total return figures, the fund’s share price is up some 60% or so over the last decade. It has more than made up for the decline during the recession and not only protected investors’ capital, but grew it. All while paying a growing dividend. That’s in sharp contrast to many other closed-end funds, which fell hard during the “great recession” and have lingered at relatively low levels. Often that’s because of return of capital limiting, or even detracting from, NAV growth. That’s frequently the trade-off for high yields. Of course, dividend cuts have also been a common occurrence, too, at other funds, which can make what was a large income stream much smaller. A worthy option If you are in the market for a utility fund, you should take a look at Reaves. Although a little expensive and potentially volatile, the fund’s long-term performance has been strong while supporting a growing dividend. The fund’s roughly 3% discount isn’t a compellingly cheap entry point, but the average discount over the past decade is around 5.5%. So, yes, it could be cheaper, but if you are looking for a good fund right now, I wouldn’t let this stop you. All in, this is a fund I’d recommend to my own father.

S&P 500 FCF Analysis: What You Do Depends On Who You Are

Analysis of the S&P 500 Index and its individual components using the “Free Cash Flow Yield” ratio. Specifically written to assist those Seeking Alpha readers who are using my free cash flow system. Generates a final result for the S&P 500 Index and explains that result to each reader depending an what type of investor they are. Back in December of last year, I introduced my free cash flow system here on Seeking Alpha, through a series of articles that you can view by going to my SA profile . My purpose in doing so was to try and teach as many investors as I could, on how to do this simple analysis on their own, as I believe in the following: “Give a person a fish and you feed them for a day, Teach a person to fish and you feed them for life” I have been very pleased with the positive feedback that I have received so far, but included in that feedback were many requests by those using my system, to see if they did their analysis correctly or not. Since the rate of these requests has been increasing with every new article I write, I have decided to start a new series of articles here on Seeking Alpha analyzing the S&P 500 Index, where I will analyze each of its components individually. That way those of you using my system will have something like a “teacher’s edition” that will give you all the correct calculations for each component. Obviously I can’t include the results for all my ratios in one article, so I will thus be doing a series of articles, where each ratio’s results for the S&P 500 Index will have its own article devoted to it. Hopefully these articles can be used as reference guides that everyone can use over and over again, whenever the need arises. Having said that, at the same time we will be “killing two birds with one stone” as we will also be analyzing the S&P 500 Index and give one final result for it as well as its individual components . That way these series of articles will also be able to give us a real time analysis of whether the S&P 500 Index is attractively priced or overvalued. In order to save space in this article (as the table that will soon follow is quite long) I would welcome everyone to read my article on how to analyze a portfolio/Index by clicking on the following link first: Warren Buffet s Berkshire Hathaway Portfolio: A Free Cash Flow Analysis That way those of you who are new to this analysis will get a complete introduction and for others already familiar with my work, let it act as a refresher course. This article with concentrate on my “Free Cash Flow Yield Ratio” Free Cash Flow Yield = Free Cash Flow per Share / Stock Market Price One key point to always remember in using this system, is that it is designed for all kinds of investors, whether you would be conservative (like I am) or a more aggressive/buy & hold investor. I have created the following parameters for each type and they are as follows: Finally it is also important to understand that I personally do not invest in financial firms as a rule, because it is quite difficult to get a very accurate free cash flow result. This is so because financial firms generate very little in the way of capital expenditures, thus the results you find below are basically just cash flow from operations. I still analyze them as they are part of the S&P 500 Index, but again I don’t invest in them as I find financial firms too complicated to analyze. This belief of not investing in financials, saved me from suffering the huge losses that this sector suffered in 2008-2009, which cost investors dearly. For those who disagree we can start a discussion on the matter in the comment section below, which will allow me to further elaborate on the matter. So without further ado here is my “Free Cash Flow Yield Analysis of the S&P 500 Index (NYSEARCA: SPY ) and its components: (click to enlarge) The final free cash flow yield result of 5.11% for the S&P 500 Index would be classified as a ” Strong Hold” for the more aggressive/ buy & hold investor and a “Weak Sell” for the more conservative investor, using the parameter tables I included at the beginning of the article . The weightings that you see in the index were generated by mirroring those used in the SPDR S&P 500 ETF . Also remember that the results shown above are just for one ratio and that this is not investment advice, but just the results of the ratio. The system outlined in this article and all that will follow, as part of this series, are just meant to be used as reference material to be included as just “one” part of everyone’s own due diligence. So in other words, don’t make investment decisions based on just this one result, but incorporate it as one part of your own due diligence.

3 Promising India Focused ETFs

Summary India will overtake China’s GDP growth rate in 201 according to IMF and I believe that Indian equities are positioned for a multi-year bull market. Infrastructure is India’s biggest challenge as well as the biggest opportunity and I believe that the sector will perform well amidst lower interest rates in the foreseeable future. India’s consumption story has just commenced and with very favorable demographics, India’s consumption is likely to grow at a robust pace making the consumer related ETF attractive. While the focus has been on large companies in the recent rally in Indian markets, the small companies hold immense long-term potential and the small-cap ETF looks attractive. India is poised to overtake China’s GDP growth in 2016 according to the IMF and I have been bullish on India since the new government came to power in 2014. Recently, I wrote an article on IMFs GDP outlook for 2015 and 2016 where I opined that India and the US are the bright spots in the global economy and I also opined that India is likely to be the best performing equity market in 2015. I had also provided two stock picks and one ETF for exposure to Indian markets. In this article, I will be discussing three more ETFs that look very interesting considering a 2-3 year time horizon. I believe that these ETFs can serve as catalyst for the portfolio and investors need to diversify to India in order to boost overall portfolio returns. EG Shares India Infrastructure ETF (NYSEARCA: INXX ) The India Infrastructure ETF is designed to measure the market performance of companies in the infrastructure industry in India. For 2014, the ETF provided returns of 20% and I believe that the ETF will provide returns in excess of 20% in 2015. The reasons are as follows – The Indian central bank cut interest rates by 25 basis points recently and another 75-100 basis points interest rate cut is likely. Lower interest rates will trigger upside for the interest rate sensitive infrastructure sector. As the chart below shows, India needs infrastructure investment of nearly $1.25 trillion over the next 10-years and as the pace of investment grows under the new government, infrastructure companies are likely to outperform. (click to enlarge) The ETF has high exposure to large and very large infrastructure companies in India and therefore the exposure is with companies having strong fundamentals. The trailing PE ratio of the ETF holdings is 17.9, which is lower than the broader NIFTY PE of 22.2. Therefore, on a relative basis, the sector is still undervalued and has upside potential. For these strong reasons, the EG Shares India Infrastructure ETF is an interesting ETF to consider not only for 2015, but with a long-term investment horizon. EGShares India Consumer ETF (NYSEARCA: INCO ) As the name suggests, the India Consumer ETF is focused on the consumption theme. For 2014, the ETF provided an extraordinary return of 48%. While the same performance might not be replicated in 2015, the fund still looks very promising for strong returns over the next 3-5 years and a return of 15% to 20% in 2015 on a conservative basis. The Indian consumption theme has just commenced and Amazon (NASDAQ: AMZN ) clocking gross sales of $1 billion in the first year of operation in India is an indication of the potential the broad consumption theme holds in India. The PwC report is also upbeat on the media and entertainment sector in India for the next 5 years. Further, India is set to become the youngest country in the world by 2020 and the favourable demographics mean that India has huge potential when it come to consumption themes such as personal goods, automobiles, media and entertainment. The India Consumer ETF provides exposure to all these sectors of the economy with exposure to all the big players in the respective industries. I therefore expect the ETF to provide stellar returns considering a time horizon of 3-5 years. India Small-Cap Index ETF (NYSEARCA: SCIF ) I believe that the Indian Small-Cap Index ETF, which has provided returns of 43% in the last one year, is another excellent ETF to consider for 2015 as well as for the next 3-5 years. The above mentioned ETFs would give investors exposure to large or very large companies in India in the respective sectors. However, there is immense potential in some of the small or mid-sized companies in India. The growth for these companies can be robust if overall economic growth and sector growth is strong. With the ETF currently having 30.1% exposure to the financial sector, 21.1% exposure to the consumer discretionary sector and 17.6% exposure to the industrials sector, the outlook for the ETF will certainly be robust in 2015. In particular, the financial sector will surge on low inflation and rate cuts and both these factors will also impact the consumer discretionary and industrials sector. As of December 2014, the ETF had a very low PE of 11.24 and I believe that the ETF has strong upside in the coming quarters. In general, the broad market rally is led by large-caps followed by mid-caps and small-caps. Therefore, I expect the ETF to start moving significantly higher based on current valuations. Conclusion India is certainly one of the most attractive markets for 2015 and I believe that the Indian economy is on a path to sustained and robust growth in the next 5-10 years. Therefore, investors need to have Indian stocks in their portfolio and the ETFs discussed have the potential of providing 15% to 30% annual returns if the government keeps its promise on drastic policy changes in the coming months.