Tag Archives: seeking-alpha

Will UNG Resume Its Descent?

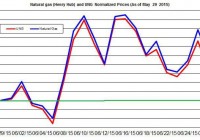
The price of UNG is up for the month on account of stronger demand in the power sector. Despite warmer weather, the cooling degree days are expected to reach normal levels this week. The normal cooling degree days could suggest the demand for natural gas in the power sector will cool down. The recent natural gas report showed the injection to storage was 75 Bcf, which was slightly lower than market expectations. Moreover, the latest buildup was below the 5-year average and last year’s injection. This news has provided a short-term boost for the shares of the United States Natural Gas ETF (NYSEARCA: UNG ) during last week. The price of UNG is slightly up for the month, but it will require a stronger demand for natural gas to bring UNG further up. For now, this scenario doesn’t seem likely. Before reviewing the latest developments in the natural gas market, shares of UNG continue to underperform natural gas prices: The impact of the roll decay on the price of UNG is demonstrated in the chart below (the prices are normalized to the end of last month). As you can see, the price of UNG rose by only 3.5% during June, while the Henry Hub by nearly 5%, i.e. a 1.5 percentage point difference. (click to enlarge) Source of data taken from EIA and Google finance According to the weekly EIA report , this week’s injection was the first time for this season to be below the 5-year average buildup. As of last week, the storage was 38% higher than the level recorded last year and 1.4% above the 5-year average. (click to enlarge) Source of data taken from EIA From the supply side, production picked up – it rose by 1%, week over week. And it’s up by 5.5% compared to last year. Based on the latest update by Baker Hughes , the number of gas rigs slightly rose by 5 to 228 rigs. Nonetheless, U.S. consumption also grew by 2.4% last week and was up by 8.5% for the year. Most of the growth in demand came in the power sector – 6.1%. This gain was partly offset by lower consumption in the industrial and residential/commercial sectors. Looking forward towards the next two weeks, the weather is expected to heat up mostly in the coastal line, including West, Northeast and South Atlantic, but the temperatures are projected to be lower than normal for this time of the year in parts of the Midwest. Despite the expected higher than normal temperatures in parts of the U.S., the cooling degree days are estimated to be only slightly higher than normal – this could suggest the rise in consumption in the power sector will slowdown. This could explain why the markets estimate this week’s injection will be close to the 5-year average buildup of 75 Bcf. The natural gas market slightly heated up in the past few weeks, but over the short run the power sector isn’t expected to heat up. Thus, the demand isn’t likely to pressure up the price of natural gas. For UNG, this could mean another pullback in its price. For more see: On the Contango in Natural Gas Market Disclosure: I/we have no positions in any stocks mentioned, and no plans to initiate any positions within the next 72 hours. (More…) I wrote this article myself, and it expresses my own opinions. I am not receiving compensation for it (other than from Seeking Alpha). I have no business relationship with any company whose stock is mentioned in this article.

When Should You Sell A Mutual Fund?

Lipper’s Jake Moeller examines some qualitative reasons to reconsider holding a mutual fund investment. Investors interested in this topic can also register to attend the Lipper UK Fund Selector & Fund of Funds Forum in London on July 14, 2015. As a former fund-of-funds manager, Lipper clients regularly ask me about sell triggers for mutual funds. This question is quite amorphous; there are many factors that could result in a fund no longer being “fit for purpose,” but that depends on how the fund is being used. When investors blend funds into a portfolio, they have different tolerances for a sell decision than when, for example, they hold a single fund in isolation. When I managed a guided-architecture platform from which I constructed a number of portfolios, I would often sell a fund out of my portfolios but still keep it on the guided-architecture platform. Such decisions are uniquely a factor of what fund selectors call “style bias.” A large-cap fund, for example, might underperform considerably in a sustained mid-cap rally, but that doesn’t mean it is a poorly managed fund. The following factors are some key reasons to consider letting a fund go: Fund manager departure Fund managers move house for myriad reasons: ambition, retirement, redundancy to name a few. If the departure is restricted to a single manager, this is generally a “hold and wait” situation. Many investors will follow the new fund manager, but a large fund house should have contingency protocols in place and the performance of the old fund shouldn’t necessarily head south. Where a fund house is very quiet about a key departure, there may be a legal covenant underpinning an unpalatable situation. A single fund manager departure can also signal the start of distracting team restructuring and destabilization. Respect the fund house that gets information out early. The less that is said, the stronger the sell signal. “Activeness” A fund manager who closely tracks an index may be doing so for perfectly legitimate reasons: a lack of conviction, a portfolio restructure, or staff changes can result in emergency indexing. It is the duration of this positioning that matters. An active equity fund manager’s maintaining an index position for over three months, for example, would certainly be a red flag. Marketing support Often overlooked in importance: when a fund house stops marketing a fund or has another flavour of the month, this can often be a bad sign. “Legacy” funds are often poorly managed, and with little inflow they potentially leave investors languishing at a disadvantage. The retrenchment of sales directors can often be another leading indicator that funds might switch to legacy footing or that they are expecting less supportive inflows into their business. Corporate activity A takeover, acquisition, or merger requires considerable analysis, but it can be reduced to a very fundamental issue: cultural compatibility. Not many strategic bond managers, for example, would take well to a new parent company’s investment committee favoring utilities at any cost “because that’s best for our balance sheet.” Capacity A fund that becomes too large to maintain a manageable number of securities in its portfolio is likely to become either an index hugger or to compromise the technical expertise of its manager. There are so many quality boutique funds in the market that there is no excuse for holding an active fund that has say 2,000 securities in it. Outflows Outflows in and of themselves are not always a concern. However, when they coincide with a falling share price (where the fund manager is listed) and poor performance, you have a pretty strong sell signal. You will want to get out before all the cabs have left the rank. Round peg, square hole Has your fund house recently appointed a head of U.K. equities for your U.S. portfolio? Fund management is a specialized task and is only rarely truly portable. An expertise in one area does not guarantee expertise in another. Such an appointment warrants critical review. Courage under fire If fund managers are underperforming when their style should be in favour, an investor needs to question the skill of the managers; most fund managers make bad calls in their career but restore faith by sticking to their guns. If poor stock selection results in a fund manager “tweaking” the process or compromising philosophies, this should act as a warning flag. Poor performance Differentiate symptom and cause. Poor performance needs to be understood, not reacted to blindly. Where poor performance is a result of style biases or out-of-favor portfolio selection, one may likely end up selling just as the fund turns around. Where poor performance coincides with any of the qualitative factors outlined above, it is unlikely to be coincidence. Furthermore, these factors may occur before performance starts to be affected. Such factors warrant serious consideration to saying adieu to a fund.

Tax Efficient Large-Cap Portfolio Management System With Minimum Volatility Stocks Of The S&P 500

This model invests periodically in eight highly liquid large-cap stocks selected from those considered to be minimum volatility stocks of S&P 500 Index. Most stock positions are held for longer than one year, resulting in a Tax Efficiency ratio of 81.4%. When adverse stock market conditions exist the model shorts the 3x leveraged Ultra Pro S&P 500 ETF – hedge/current holding ratio= 45%. The model produced a simulated average annual return of about 36% from Jan-2000 to end of June-2015. The Minimum Volatility Stock Universe of the S&P 500 Minimum volatility stocks should exhibit lower drawdowns than the broader market and show reasonable returns over an extended period of time. It was found that a universe of stocks mainly from the Health Care, Consumer Staples and Utilities sectors satisfied those conditions. This minimum volatility universe of the S&P 500 currently holds 117 large-cap stocks (market cap ranging from $4- to $277-billion), and there were 111 stocks in the universe at the inception of the model, on Jan-2-2000. The Best8(S&P 500 Min-Volatility)-US Tax Efficient This model differs from our Best8(S&P500 Min-Volatility) system with regard to the hedge used and additional sell rules to make holding periods mostly longer than one year so that long term capital gain tax rates would apply. Also a position showing a loss greater than 25% may be sold earlier. All other parameters and ranking system are the same. Under some conditions, such as mergers, a stock will be sold and replaced. This may invoking a short term gain for tax purposes if the holding period was less than one year. The model assumes that stocks are bought and sold at the next day’s average of the Low and High price after a signal is generated. Variable slippage accounting for brokerage fees and transaction slippage was taken into account. Tax Efficiency of the Best8(S&P500 Min-Volatility)-US Tax Efficient An analysis of all the realized trades is shown in Table 1. There were 91 winning stock trades of which 86 had holding periods longer than 1 year. All winning hedge trades had holding periods less than 1 year. The Tax Efficiency was defined as the ratio of total $ gains of winners held longer than 1 year to total $ gains of all winners: 81.4% for this model. By comparison, the Tax Efficiency of the Best8(S&P500 Min-Volatility) system which trades frequently was only 18.6% as shown in Table 2. Since both models show the same annualized return of about 36% it would be more advantageous to follow the Tax Efficient system when trading outside a tax-sheltered account. Performance In the figures below the red graph represents the model and the blue graph shows the performance of benchmark the SPDR S&P 500 Trust ETF ( SPY). Figures 1, 2 and 3 show performance comparisons: Figure 1: Performance 2000-2015 and hedging with short the ProShares UltraPro S&P 500 ETF ( UPRO). Annualized Return= 36.1%, Max Drawdown= -19.8%. The model uses a hedge ratio of 45% of current holdings during down-market conditions. (Note: The inception date of UPRO was June 23, 2009. Prior to this date values are “synthetic”, derived from the S&P 500.) Figure 2: Performance 2000-2015 without hedging. Annualized Return= 21.4%, Max Drawdown= -34.7%. The drawdown figure confirms that minimum volatility stocks perform better than the broader market which had a -55% max drawdown. Figure 3: Performance 2009-2015 with hedging. Annualized Return= 35.8%, Max Drawdown= -17.4%. (click to enlarge) (click to enlarge) (click to enlarge) Figures 4 to 8 show performance details: Figure 4: Performance 2000-2014 versus SPY. Over the 15-year period $100 invested at inception would have grown to $9,889, which is 54-times what the same investment in SPY would have produced. Figure 5: 1-year returns. Except for 2006 the 1-year returns were always higher than for SPY. There was never a negative return in one calendar year. Figure 6: 1-year rolling returns. The minimum 1-year rolling return of the 3-day moving average was -2.9% early in 2008. Figure 7: Distribution of monthly returns. One can see that the monthly returns follow a normal distribution, displaced to the right relative to the returns of SPY. Figure 8: Risk measurements for 15-year and trailing 3-year periods. (click to enlarge) (click to enlarge) (click to enlarge) (click to enlarge) Disclaimer One should be aware that all results shown are from a simulation and not from actual trading. They are presented for informational and educational purposes only and shall not be construed as advice to invest in any assets. Out-of-sample performance may be much different. Backtesting results should be interpreted in light of differences between simulated performance and actual trading, and an understanding that past performance is no guarantee of future results. All investors should make investment choices based upon their own analysis of the asset, its expected returns and risks, or consult a financial adviser. The designer of this model is not a registered investment adviser.