Tag Archives: seeking-alpha

Tough Choices: Alternative Funds In 2015

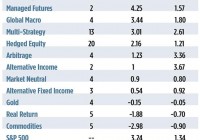
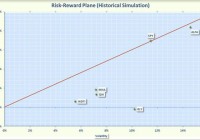
The Oxford English Dictionary provides two definitions of the adjective “alternative.” In one, the term is used to describe something “available as another possibility or choice.” The other, more proscriptive definition pronounces the choice between two things as “mutually exclusive.” In what context are we to view “alternative investments” or “alts”? Are they portfolio adjuncts or replacements? These nontraditional assets are, for the most part, utilized for risk diversification within a portfolio, not as a portfolio themselves, so it’s good to keep this in mind when reviewing performance records. Yes, returns are important but so, too, are correlation and other dynamics. Ideally, alts should be the yin to a portfolio core’s yang. Once available only to well-heeled investors through privately placed hedge funds, an increasing number of alternative investment strategies can now be found in mutual fund and exchange traded product wrappers. The array of retail-sized alts has, in fact, become dazzling. Last year, 109 liquid alt products debuted and this year’s shaping up to be similarly fecund. Through May, 54 new funds have been launched. This proliferation is a recent phenomenon, though. Relatively few liquid alt products can truly be considered seasoned. All told, when the alt universe is culled for funds with track records extending five years or more, just 68 candidates squeak through. So how have these time-tested funds fared in 2015? Just three categories–risk parity, managed futures and global macro-have outdone the broad-based domestic equity market through mid-year. In some cases, that’s to be expected; the idea is that these funds will dampen volatility of an overall portfolio and provide some cushion for a falling market. For many alts, that thesis has yet to be tested, of course, and in an extended bull market, it gets harder to make the case for funds that don’t keep up. So here, we’ll concentrate on the strategies that have enhanced returns over the broader market. Risk Parity Risk parity? What’s that? An in-depth examination of risk parity strategies can be found in REP. ‘s March issue, but the quick-and-dirty is this: These portfolios allocate assets on the basis of risk, not dollars. Typically, risk is balanced by overweighting lower-volatility assets. The granddaddy of risk parity funds is the AllianceBernstein Global Risk Allocation Fund (MUTF: CABNX ), which keys on tail risk to invest in an array of global asset classes. “Tail risk” refers to the probability of a significant downside event. Allocations are made so that each class contributes equally to the fund’s expected tail loss. Through May, CABNX rose 4.51 percent, comfortably ahead of the 3.24 percent contemporaneous gain in the SPDR S&P 500 Trust ETF (NYSEARCA: SPY ). CABNX’s year-to-date gain came in second to that of its category mate, the AMG FQ Global Risk-Balanced Fund (MUTF: MMAFX ). The AMG portfolio, which recorded a 5.13 percent total return through May, primarily relies on derivatives to dynamically balance risk. Over a five-year span, these risk parity funds have done yeoman’s work, coming in second behind hedged equity products in average annual returns. Still, given the strength of the protracted stock market rally, alpha-positive alpha, that is-remains elusive. Managed Futures The case for short-enabled active management was emphatically made in the commodities sector this year. Unlike commodity index trackers, actively managed futures funds can short-sell with as much abandon as they can buy. Margin’s the same, and so too the practical risk for either a long or short market stance. And a good thing that was for fund runners this year. Most of 2015’s commodity price action has been to the downside, primarily led by plummeting tariffs for oil. The Equinox MutualHedge Futures Strategy Fund (MUTF: MHFAX ) capitalized upon this trend and other tactics by allocating its assets to several subadvisors with diverse trading styles. Through May, MHFAX gained 5.27 percent, outdoing the 3 percent earned by its single-manager category mate, the Guggenheim Managed Futures Strategy Fund (MUTF: RYMTX ). Over the long run, managed futures have been a middling performer on the alts stage, but still have handily outperformed long-only commodity actors. Global Macro Big picture investing paid off in 2015’s first half as global macro products collectively eked out a 20 basis point advantage over the gain earned by an S&P 500 proxy. Global macro strategies bank on forecasts and trends in systemic factors such as interest rates, policy changes and fund flows. Leading the charge, the PIMCO Global Multi-Asset Fund (MUTF: PGAIX ) returned a best-of-class 6.35 percent through May. PGAIX fund runners allocate assets across a spectrum of equities, fixed income securities and commodities, utilizing a top-down approach enhanced by some bottom-up alpha-seeking tactics. Tail risk hedging is also employed to insulate the portfolio. That said, PGAIX isn’t the least volatile fund in the category, but neither is it the most. The Ivy Asset Strategy Fund (MUTF: WASAX ) actually has the best five-year Sharpe ratio (0.74) in the category, but its inherent volatility can take investors on a bit of a roller coaster ride. What’s Not Hot This year’s laggards are physical assets-gold, real return assets and commodities. No surprise there, given the disinflationary mood in early 2015. All five seasoned commodities funds were under water through May, some significantly more than others. The tiny Rydex Commodities Strategy Fund (MUTF: RYMEX ) floated just below the surface with a -0.72 percent return while the Direxion Indexed Commodity Strategy Fund (MUTF: DXCTX ) foundered with a 5.54 percent loss. Such disparate performance arises because the funds track dissimilar indices: DXCTX a long/flat benchmark comprised of a dozen commodities and RYMEX a broader-based long-only construct. Real return funds pursue strategies that seek to outperform the broad equity market during periods of rising inflation. Typically, these funds invest in a portfolio of “real” assets including interests in residential property, energy, metals and agriculture. Three of the five real return portfolios were actually above water in May, but because the behemoth PIMCO Commodity Real Return Strategy Fund (MUTF: PCRIX ) commands an 89 percent market share, its 2.24 percent loss dragged the category return down. Three of four senior gold funds, tracking the metal’s spot price assiduously, ended May at pretty much the same level as the year’s start. One portfolio, the PowerShares DB Gold ETF (NYSEARCA: DGL ), which replicates the returns of gold futures rather than bullion, underperformed the others, largely due to the continuous costs of rolling expiring contracts forward. The Road Ahead If you look at the five-year track records recapped in Table 2, one thing becomes readily apparent: the higher a category’s correlation to the broad market, the better its performance. The average annual returns of the top five categories, all pegged against the S&P 500, line up perfectly with their r-squared correlations. No doubt, those funds have basked in the warmth of a torrid equity market. The stock rebound will one day turn to a dribble and when it does, the out-of-favor categories will have an opportunity to rise to the top of the league table. It’s then that the alpha column is more likely to be populated by positive numbers. This article originally appeared in the July issue of REP. Magazine and online at WealthManagement.com .

Do Hedge Fund ETFs Live Up To Their Hype?

Summary Hedge fund ETFs provide a convenient way for retail investors to gain exposure to hedge fund strategies. Some, but not all, hedge fund ETFs were relatively uncorrelated with the S&P 500. Hedge fund ETF performances have been uneven, with some funds outperforming while others lagged. Hedge funds offer investors an alternative to traditional investment funds. Hedge funds can use leverage to increase returns and can also invest in a wide range of derivatives and short positions. Over the years some have scored phenomenal successes while others have suffered spectacular losses. Hedge funds are not currently regulated by the Securities and Exchange Commission (SEC) so only “accredited investors” can participate. Accredited investors must have a net worth of at least a million dollars or an income greater than $200,000 a year. Even if you meet the financial requirements, most funds charge a 2% management fee plus take 20% of the profits. These high charges are not for me so I looked for some alternatives to hedge funds among the plethora of Exchange Traded Funds (ETFs). The hedge fund ETF category includes funds with a variety of strategies including convertible arbitrage, managed futures, merger arbitrage, and tend following. Note that the ETFs in this category do not actually invest in hedge funds but instead try to replicate hedge fund performance. There are currently 22 ETFs in the hedge fund category but only five have assets over $100 million. These larger ETFs are summarized below. IQ Hedge Multi-Strategy Tracker ETF (NYSEARCA: QAI ). This ETF is based on techniques called “hedge fund replication” that try to reproduce hedge fund returns using a portfolio of conventional assets. The fund goes long or short other ETFs in an attempt to replicate the risk-adjusted performance of a mix of hedge funds. QAI uses a rules based momentum strategy to decide which assets to buy or short. The portfolio can change monthly depending on the economic environment but generally this fund maintains a large net long allocation to bonds, which can be rotated among Treasuries, corporate bonds, floating rates, high yield, and convertible bonds. The fund also invests in equities, currencies, commodities, and REITs. The effective duration of the bond portion of the portfolio is a little over 4 years. The fund has an expense ratio of 0.91% and yields 1.3%. This is the largest hedge fund ETF with an asset base of over $1 billion and a daily average volume of more than 180,000 shares. IQ ARB Merger Arbitrage ETF (NYSEARCA: MNA ). This ETF invests in global companies where there has been an announcement of an imminent merger or takeover. Merger arbitrage attempts to capture the difference between the current price of the takeover target and the final price. This is a market neutral strategy that has typically been relatively low risk. The fund currently has 58 holdings with 45% in US stocks, 15% in non-US stocks, and 40% in cash. The expense ratio is 0.76% and the fund does not generate any yield. The daily volume averages only 23,000 shares so limit orders should be used when buying or selling this fund. WisdomTree Managed Futures Strategy ETF (NYSEARCA: WDTI ). This actively managed WisdomTree ETF provides returns based on the Diversified Trend Indicator (DTI). DTI is a trend following, quantitative strategy developed by Victor Sperandeo (also known as “Trader Vic”). The DTI is used to go long or short futures associated with 24 components in 18 sectors. The futures cover a wide range of the liquid future markets including currencies (50%), energy (19%), livestock (5%), precious metals (5%), industrial metals (5%), and agriculture (16%). The fund is rebalanced monthly. The expense ratio is 0.95% and the fund does not have any yield. The daily volume averages only 34,000 shares per day so limit orders should be used when buying or selling this fund. AlphaClone Alternative Alpha ETF (NYSEARCA: ALFA ). This ETF invest in the securities that are widely held by hedge funds and institutional investors. This strategy is possible because hedge funds that manage more than $100 million must periodically disclose their equity holdings. The selection of the securities is based on a proprietary index methodology. The portfolio is also risk-managed and can vary from long-only to a heavily hedged position. The portfolio currently consists of 74 holdings with 83% from the US and 17% international. The sector breakdown includes 24% technology, 20% health care, 14% consumer staples, and 14% industrials. The expense ratio is 0.95% and the fund yields less than 1%. The daily volume averages only 22,000 shares so limit orders should be used when buying or selling this fund. SPDR Multi Asset Allocation ETF (NYSEARCA: RLY ). This is an actively managed ETF that is focused on securities that traditionally provide good inflation hedges. The portfolio consists of 12 ETFs, with a focus on inflation-linked bonds (19%), commodities (17%), REITs (20%), and natural resource companies (38%). The fund has an expense ratio of 0.70% and yields 2.3%. The daily volume is extremely small with an averages of only 5,000 shares so limit orders should be used when buying or selling this fund. For reference I also included the following funds in the analysis: SPDR S&P 500 Trust ETF (NYSEARCA: SPY ). This ETF tracks the S&P 500 index and has an ultra-low expense ratio of 0.09%. It yields 1.9%. SPY will be used to compare the performance of the hedge fund ETFs to the broad stock market. To assess the performance of the hedge fund ETFs, I plotted the annualized rate of return in excess of the risk free rate (called Excess Mu in the charts) versus the volatility for each of the funds. I used 1% as an estimate for the risk-free rate. I would have liked to see how these ETFs performed during the 2008 bear market but the oldest fund was not launched until 2009. Most of the other funds only have a 3 year history so I used a 3 year look-back period from June, 2012 to June, 2015. The Smartfolio 3 program was used to generate the plot shown in Figure 1. (click to enlarge) Figure 1. Risk versus reward over past 3 years Figure 1 illustrates that the hedge fund ETFs have had a large range of returns and volatilities. To better assess the relative performance of these funds, I calculated the Sharpe Ratio. The Sharpe Ratio is a metric, developed by Nobel laureate William Sharpe that measures risk-adjusted performance. It is calculated as the ratio of the excess return over the volatility. This reward-to-risk ratio (assuming that risk is measured by volatility) is a good way to compare peers to assess if higher returns are due to superior investment performance or from taking additional risk. In Figure 1, I plotted a red line that represents the Sharpe Ratio associated with SPY. If an asset is above the line, it has a higher Sharpe Ratio than SPY. Conversely, if an asset is below the line, the reward-to-risk is worse than SPY. Some interesting observations are evident from the figure. With the exception of ALFA, these funds were significantly less volatile than the S&P 500. However, this decrease in volatility was accompanied by an even larger decrease in return. Therefore, with the exception of ALFA, SPY easily outperformed these hedge funds on a risk-adjusted basis. ALFA was the best performer among all the hedge fund ETFs (on both an absolute and risk-adjusted basis). This is not too surprising since piggybacking on the equity portfolio of hedge funds would be expected to perform well in a bull market. However, ALFA was very volatile and slightly under-performed SPY on a risk-adjusted basis. RLY was the worst performer. Again, this was not surprising since inflation has been tame and precious metals have been in a bear market. WDTI had the lowest volatility but also a relatively low return that only beat RLY. Even though MNA and QAI employed different strategies, they booked similar risk-adjusted returns. One of the advertised advantages of hedge funds is the low correlation with the stock market. To assess the validity of this claim, I calculated the pair-wise correlations between the funds. The results are shown as a correlation matrix in Figure 2. The symbols for the funds are listed in the first column and along the top of the figure. The number at the intersection of the row and column is the correlation between the two assets. For example, if you follow WDTI to the right for two columns you will see that the intersection with MNA is 0.004. This indicates that, over the past 3 years, WDTI and MNA were only 0.4% correlated. Note that all assets are 100% correlated with themselves so the values along the diagonal of the matrix are all ones. Figure 2. Correlation matrix over past 3 years The figure illustrates that, with the exception of ALFA, hedge funds provide good diversification relative to the overall stock market. As you might expect, ALFA is highly correlated with SPY since the portfolio of ALFA consists of popular stocks from the S&P 500. The managed futures fund, WDTI, is basically uncorrelated with all the other funds so it provides excellent diversification. The other ETFs (MNA, QAI, and RLY) are only moderately correlated with each other and the stock market.. For my last analysis, I reduced the look-back period to 12 months. The results are shown in Figure 3. What a difference a couple of years make. During this period, both WDTI and MNA performed well and had essentially the same risk-adjusted return as the overall stock market. ALFA again was the best performer and actually beat out the S&P 500 on both an absolute and risk-adjusted basis. RLY as again the worst performer, sinking well below the zero line. (click to enlarge) Figure 3. Risk versus reward over past 12 months. Bottom Line Hedge fund ETFs cannot all be lumped together and some lived up to their hype while other did not. ALFA was by far the best performer but it is highly correlated with the S&P 500. If you are looking for a hedge against a stock market correction, I would not use ALFA. However, if you are risk tolerant and want exposure to the overall market, ALFA is worth consideration. As a hedge, I like WDTI and MNA. These are low volatility funds, have a reasonable return, and are relatively uncorrelated with the stock market. In a bull market, these funds will lag but I do think they have lived up to their reputation as a vehicle to hedge the market. Unfortunately, the most popular fund, QAI, has not lived up to its hype. RLY may do well in the future but until inflation increases, I would avoid this fund. Disclosure: I/we have no positions in any stocks mentioned, and no plans to initiate any positions within the next 72 hours. (More…) I wrote this article myself, and it expresses my own opinions. I am not receiving compensation for it (other than from Seeking Alpha). I have no business relationship with any company whose stock is mentioned in this article.

Rising Correlations With Greece In Graphs

Graphical depiction of the correlation between Greek stocks and the rest of the Eurozone. Correlations have been rising as we careen towards a hard deadline on an extension of the current bailout agreement. If a disorderly outcome in Greece unduly drags down stocks in core countries disproportionately, long-term investors should view it as an opportunity. With the Euro-area finance ministers denying Greece a short-term extension of the country’s bailout and with no future financing in place, we are in for a potentially tumultuous week ahead. The Greek government in turn has called for a referendum vote on demands international creditors have made on the country in exchange for ongoing financial aid. Correlations between the exchange between the Euro Stoxx 50 (NYSEARCA: FEZ ) and the Athens Stock Exchange (NYSEARCA: GREK ) have been rising in recent weeks as the ebbing market perception of the likelihood of a deal is felt throughout the continent’s equity markets. Source: Bloomberg As recently as the end of March, the rolling one-month correlation between Greek stocks and a broad gauge of Eurozone stocks was zero. This makes intuitive sense. Greek stocks were subject to increased volatility following the election of the anti-austerity Syriza party in late January. European stocks were rebounding on the back of strengthening European economic data, but Greek stocks were being pulled lower due to the increased uncertainty around its financing package. In recent weeks, Greek stocks and their European counterparts have been seeing heightened correlation as graphed above. If broader European stocks hit an air pocket next week in the face of the Greek referendum vote, broader European stocks could be pulled down unduly in sympathy amidst this heightened correlation. The median company in the Euro Stoxx 50 has a market capitalization six times larger than bottler Coca-Cola Hellenic, the largest company in Athens Stock Exchange, which represents nearly one-fifth of that index. European stocks are being led by the nose by an economy that makes up less than two-percent of its economic output. As I wrote following my recent trip to Greece , if there is a disorderly outcome, the European financial system should be much better equipped given stronger capital ratios, new stability mechanisms, the deployment of quantitative easing, and lower sovereign yields in the periphery. Near-term dislocations due to outsized correlations with Greek stocks and that of the rest of Europe should be viewed as a longer-term opportunity to grab exposure to developed markets that have lagged the performance of the United States post-crisis and could potentially deliver higher forward returns . Disclaimer : My articles may contain statements and projections that are forward-looking in nature, and therefore inherently subject to numerous risks, uncertainties and assumptions. While my articles focus on generating long-term risk-adjusted returns, investment decisions necessarily involve the risk of loss of principal. Individual investor circumstances vary significantly, and information gleaned from my articles should be applied to your own unique investment situation, objectives, risk tolerance, and investment horizon. Disclosure: I/we have no positions in any stocks mentioned, and no plans to initiate any positions within the next 72 hours. (More…) I wrote this article myself, and it expresses my own opinions. I am not receiving compensation for it (other than from Seeking Alpha). I have no business relationship with any company whose stock is mentioned in this article.