A Look At Direxion’s Revised S&P 500 Volatility Response Shares ETF
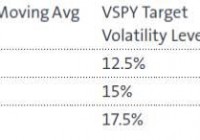
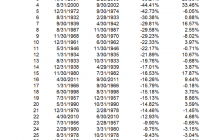
Summary Direxion’s newly revised VSPY offers investors a transparent, formula-based volatility hedge for U.S. equities. The fund employs dynamic, daily-rebalanced exposure, rather than attempting to time entry/exit points. I recreate a similar index to back-test Direxion’s strategy on two recent “black-swan” events. Back in January of 2012, Direxion made a few ripples when it announced the launch of three new ETFs giving investors access to the S&P Dow Jones Indices’ Dynamic Risk Control Index series. Unlike the few existing hedge products of the day, these ETFs didn’t try switching between the market and the VIX itself, rather they employed a more conservative approach and, in times of heightened volatility, switch into Treasury Bills instead. Certain aspects of these funds must have fallen out of favor however, as in August of 2014 Direxion announced an index and name change to its largest of the three funds, the Direxion S&P 500 RC Volatility Response Shares ETF (NYSEARCA: VSPY ) . VSPY follows the S&P DJI index of the same name (Bloomberg ID: SPXVRT). If you’re trying to find the index’s specific page on S&P’s website, I’m afraid it doesn’t exist. An e-mail to S&P in February returned the simple response “…the page is still under development at this time.” Regardless, VSPY’s literature explains the fund’s process in enough detail. Methodology From VSPY’s fact sheet : The strategy follows a quantitative rules-based equity index that seeks to mitigate risk by dynamically changing total equity exposure based on volatility signals. The strategy reallocates exposure between equities and U.S. Treasury Bills (T-Bills) based on recent volatility levels of the S&P 500 ® Index. The strategy employs a downside risk mitigation strategy during periods of higher volatility and increases equity exposure when appropriate. Basically, VSPY holds the S&P 500 U.S. Large-Cap Index and tracks some formula of market volatility to determine how much to stow away into Treasuries. That formula is comprised of two parts: a Volatility Level, and a Volatility Signal. The Volatility Level is simply determined by tracking the 20-day moving average of the CBOE Volatility Index (VIX), and pulling the value from the following table: Calculation of the Volatility Signal is less clear. In “Step 2” on VSPY’s fact sheet, it’s referred to as simply the “…(standard deviation) of the S&P 500 Index,” yet from the fund’s prospectus, “The [fund] then reviews several volatility factors of the S&P 500 Index. The volatility factors of the S&P 500 Index are exponentially weighted with more emphasis placed on the most recent historical periods.” This duality begs a couple questions: What are these several factors? Over what period are these factors analyzed? How are they exponentially weighted? My guess is Direxion needs to keep at least some part of this fund a trade secret, but we digress. Once calculated, the fund then uses these two volatility values to determine its equity holding, according to the following formula: This method is fully capable of holding 100% equity, and per the rules, never holds less than 10%. Running the spectrum of possible inputs generates the following Equity Exposure chart: (click to enlarge) The result is the fund is able to withdraw from the market when the water gets choppy, and ease back in when volatility settles. The three distinct Volatility Levels (probably derived from historical analysis) allow the fund to maintain appropriate equity exposure during varying degrees of whatever happens to be “normal” volatility. VSPY, unlike most lumbering ETFs that rebalanced on a quarterly basis, has the ability to modify its exposure daily, and does so at least monthly. There’s mention of “thresholds” the fund employs to likely keep from rebalancing too often and running up transaction costs. Investors in VSPY of course want to know how it performs relative to just the plain old S&P 500. The SPDR S&P 500 Trust ETF (NYSEARCA: SPY ) is a good benchmark. Data for VSPY however only goes back to January 2012 when the fund began trading. It should be no surprise that throughout the ongoing bull market VSPY has underperformed the S&P 500. As the chart below shows, VSPY on average does return ~1.5% less volatility on a monthly basis; however, its low trading volume and lower yield have resulted in periods where its volatility actually exceeded that of the S&P 500: (click to enlarge) Obviously, comparing a volatility hedge fund to its equity index isn’t fair in a bull market. Since we’re essentially comparing risk-returns, I’m sure someone in the comments will ask “Well, why don’t you just compare their Sharpe Ratios?” I’ll caution that the Sharpe Ratio is best for apples-to-oranges comparisons where the strategies and holdings are different. VSPY and SPY hold the exact same equities; a chart of these funds’ returns vs. their risks will just be a translation of VSPY’s equity exposure chart. Notwithstanding, strategies like these still beg to be stress tested. As I discuss later, I believe VSPY’s target audience is probably the crowd that fears drawdowns above all. Two popular “black-swan” events of the recent past are the Dot-Com bust of the early 2000s and the Mortgage Bubble collapse of 2008. Since neither VSPY’s data (nor index) go that far back, we’ll need to use the equity allocation formula above to reconstruct this fund’s index. The Volatility Level is easily gathered from historical VIX values, however, that Volatility Signal remains a mystery. For this analysis, I’m using a 20-day moving average of the S&P 500’s annualized volatility. I also blindly (i.e. no threshold) rebalance the index once a week, based on the previous week’s determined equity exposure. The chart below compares my best attempt at recreating the S&P 500 Volatility Response Shares Index with VSPY: (click to enlarge) As you can see, it’s not perfect. Clearly, VSPY’s threshold for rebalancing and/or the mysterious means it uses to determine S&P 500 volatility are large performance factors. Despite the green-line correlation dipping negative for some moments, our recreated index’s overall correlation for this period is actually above 0.90. I believe that’s enough to press on with our stress tests, but please take the following charts with a bowl of salt: (click to enlarge) (click to enlarge) At first glance, it works! VSPY’s equity allocation algorithm successfully allows the fund to avoid catastrophic plunges. The long game however is a different story. Since as far back as SPY’s data goes, our reconstructed index has struggled to keep up. I’ve also included the Vanguard Balanced Index Fund (MUTF: VBINX ) for comparison: (click to enlarge) Again, my attempt at reconstructing the S&P 500 Volatility Response Index was less than stellar and underperformed the actual VSPY for its first year. However, the inclusion of VBINX in the above chart is to emphasize that while a carefully constructed volatility hedging strategy might lessen the blow of an economic downturn, so does diversification. Replicating the Strategy Yourself One thing to watch out for is purveyors of these boutique funds like to charge significant expense ratios, some more justified than others. In VSPY’s case, the fund is simply switching between two components, the S&P 500 and short-term U.S. Treasuries. Go figure there’s a world of low-cost ETFs for both of those asset classes; we have SPY to access large-cap U.S. equities and the Schwab Short-Term U.S. Treasury ETF (NYSEARCA: SCHO ) for short-term Treasuries. Expense ratios are 0.0945% and 0.08% respectively. In comparison, VSPY’s expense ratio of 0.45% is more than quadruple that of SPY, but there’s two catches: If your platform charges any more than $0.99 for commissions, rebalancing on a daily or weekly basis, even with just one ETF, will kill your returns. The 500 components of the S&P 500 all operate on different dividend schedules, when you lump them into an ETF like SPY, you as an investor have a once-a-month shot to capture those dividends. Since VSPY owns 500+ individual stocks within its equity portfolio, it can far more efficiently expose its assets to that income calendar. For these reasons, I think VSPY’s expense ratio of 0.45% is quite reasonable, it’s also half that of the average hedged ETF . Similar ETFs RBS runs a similar series of volatility-averse funds called the Trendpilot family. When a simple 200-day moving average trigger is reached, these funds dump all of their holdings into Treasuries until the trend breaks and they re-enter their equity position. Though the prospectus for their RBS U.S. Large Cap Trendpilot ETN (NYSEARCA: TRND ) claims long-term outperformance of its benchmark, the 100% on/off strategy can result in a very choppy investing experience. As I postulate in this article , these switching-style funds are most likely marketed towards the Nervous Nellie’s. Folks that reasonably don’t want to be caught off-guard by a dot-com bust or hidden mortgage crisis. On the same note however, I can also imagine how watching assets skyrocket while one’s supposed sleep-well fund is still holding flat-line Treasuries probably induces the same performance anxiety. Dynamic exposure, as we see in VSPY, is a fair compromise. Alternative Strategies As a dozen asset allocation articles on Seeking Alpha will tell you, diversification is not to be overlooked. The same risk-return profile offered by VSPY can easily be achieved with proper diversification. Replacing one’s equity portfolio allocation with VSPY might produce an interesting conservative combo. Selling calls against one’s equity holdings can also generate income and help reduce volatility. A variety of passive ETFs exist to make this alternative easy. Though it’s enjoyable to sell one’s own calls, watch your brokerage for added costs. I quit using OptionsHouse because they started charging a processing fee on letting options expire. Closing Remarks Direxion’s VSPY offers investors convenient, low-cost access to U.S. equities while hedging against short- to mid-term rises in volatility. Rather than attempt to time the market like similar ETFs, VSPY reacts organically, withdrawing when the water gets choppy and easing back in when skies begin to clear. Our reconstructed index shows the strategy can help avoid catastrophic downturns, but will lag in bull markets. Low volume and little dividends also hurt performance. Alternative strategies such as covered-call selling or asset diversification can probably produce the same hedging effects. Disclosure: I/we have no positions in any stocks mentioned, and no plans to initiate any positions within the next 72 hours. (More…) I wrote this article myself, and it expresses my own opinions. I am not receiving compensation for it (other than from Seeking Alpha). I have no business relationship with any company whose stock is mentioned in this article.