Tag Archives: nysearcacorn

3 Agricultural ETFs Rising On Wet Weather

After a rough patch over the last six months, thanks to a stronger dollar and accelerated crop plantation on a favorable weather outlook, agricultural ETFs seem to have turned the corner. Last week was great for the beaten down agro-based commodities, as worries over wet weather in America’s key growing belts led traders to bet on the contracts of several agricultural commodities. Almost all agro-based commodities added gains last week (as of June 26, 2015) and are likely to see more surges in the short term. Fears that led to this spike revolved around weather in the key grains growing states in the Midwest. Existing wet and cold weather and predictions for more rains are causing delay in the planting of this year’s crops by farmers. Some analysts have been pointing to El Nino for this wet weather condition in North America. In fact, Citigroup expects agro-based commodities to deliver as much as 25% gains this summer ( per Bloomberg ). Investors should note that El Niño, a warm-water phenomenon that blows up off the Pacific coast of South America, causes drought in some regions of the world and floods in others. Below we highlight a few agricultural exchange-traded products which have the potential to trounce the overall agro-based commodity space and offer investors some sweet returns from the wet weather despite the broad-based commodity market gloom on the dollar strength. Wheat Speculation of cold weather in the U.S. pushed the wheat prices to a 6-month high as such weather would curb production in the U.S. southern Great Plains . The area has already experienced massive rains that can even cause a flood. High levels of humidity go against crop quality, causing farmers to hold back the cropping. Due to this, wheat prices have also been soaring. Investors can easily play this trend via Teucrium Wheat ETF (NYSEARCA: WEAT ), a commodity product from the issuer Teucrium. This fund invests in wheat futures that are traded on the CBOT, but does it in a way that looks to lower contango issues. This $27.3 million wheat ETF was the top-performer last week, having returned over 12%. Corn Much like the wheat market, the price of corn is also rallying. Thunderstorms have already hurt budding corn crops in a few areas and now lower plantings will likely have an adverse effect on stock piles. Teucrium Corn ETF (NYSEARCA: CORN ) – a fund that provides investors direct exposure to the corn commodity – was up about 6% last week. The $82 million fund was otherwise down 21% in the last one-year period. Soybean Farmers are sowing soybeans at the most sluggish pace seen in 19 years, this time of the year . A delayed planting will result in a below-average yield, per the source. As a result, soybeans futures are seeing an uptrend. The $6.4 million Teucrium Soybean Fund (NYSEARCA: SOYB ), which looks to track the daily changes of a weighted average of the closing prices for three futures contracts for soybeans, was up 3.5% last week. Notably, the grain was at a five-year low level to start the month. Miscellaneous ETF Choices There are options for investors interested to play the above three commodities via a single product. To do this, investors should not tap the pure play choice; rather they should target a host of miscellaneous ETFs having exposure in the trio. MLCX Grains Index TR ETN (NYSEARCA: GRU ), DJ-UBS Grains Total Return Sub-Index ETN (NYSEARCA: JJG ) and DJ-UBS Agriculture Subindex Total Return ETN (NYSEARCA: JJA ) are some of the ETFs which are highly invested in the trio and accordingly shot up last week. GRU, JJG and JJA were up 12%, 9.6% and 7.3% respectively. Original Post
Yet Another Reason To Like CORN: A Low Valuation Relative To Gold

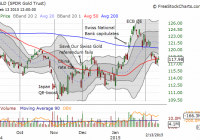
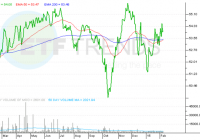
Summary The gold/corn ratio is extremely high relative to recent history. The bounce in CORN since a 40-year high (at least) in the gold/corn ratio seems to confirm a mean reversion is underway. Given corn’s strong underlying demand and a likely trading range for gold, I am betting on higher corn prices to drive most of the on-going mean reversion. I am finally starting to look over the rich agriculture-related resources provided by Teucrium Trading LLC , the financial firm that runs several agricultural ETFs: Teucrium Corn ETF (NYSEARCA: CORN ), Teucrium Soybean ETF (NYSEARCA: SOYB ), Teucrium Sugar ETF (NYSEARCA: CANE ), Teucrium Wheat ETF (NYSEARCA: WEAT ), and Teucrium Agricultural ETF (NYSEARCA: TAGS ) (TAGS invests the other four Teucrium ETFs). As an investor in CORN, I am particularly interested in understanding the supply and demand dynamics of the corn industry. What has my attention right now is an apparent trading signal provided by the amount of gold (NYSEARCA: GLD ) it takes to buy a bushel of corn. It is common to quantify the price of goods using gold as a frame of reference independent of a given paper currency. I have done this with oil and the S&P 500, but I have never thought to do it with agricultural products. In ” Portfolio Rebalancing – a Potentially Golden Opportunity ,” Teucrium references a Bloomberg article from September 24 titled ” Corn Trading Cheapest to Gold Since 1975 Signals Bottom ” to describe the opportunity for exchanging relatively “expensive” gold for relatively “cheap” corn. While I argued last month that it was time to end short-term trades going long gold , I did not think of gold being expensive (more like overbought relative to bets against path to monetary tightening). As expected, SPDR Gold Shares has fallen from the peak defined by QE in the eurozone…Yet, trading just above 5-year lows, it hardly “seems” expensive CORN is also trading near levels last seen five years ago, but it has dropped by 50% and more from recent highs. Since reaching its peak in 2012, CORN has traded ever downward with only two respites The current respite for CORN started, you guessed it, right after the Bloomberg article appeared noting corn’s cheapness relative to gold. Here is a telling chart reproduced by Teucrium. Corn is as cheap as ever relative to gold When I have argued for buying CORN off the lows , I have mainly relied upon a contrary argument that plays on an assumed cyclic nature of the prices for agricultural commodities. I have also noted strong underlying long-term demand dynamics confirmed by Deere’s CEO and soaring demand in China . However, the supply side has been volatile – corn has enjoyed several bumper crops after massive droughts in the U.S. last sent corn prices soaring in 2012. The February, 2015 U.S. Department of Agriculture (USDA) report reproduced by Teucrium along with other worldwide data shows U.S. corn inventory projected at 1.8B bushels, levels last seen in the 2005-2006 crop year. Current inventories are 13.4% of projected total usage. Similar percentages were last seen between the 2008-2009 and 2009-2010 crop years. This five-year high for corn inventory relative to total usage is an important benchmark because it turns out that worldwide demand for gold hit a five-year low at the end of 2014 . These 5-year spans for corn and gold could of course be pure coincidence, but they put current dynamics in good longer-term perspective: current conditions are pushing toward extremes. Assuming that gold is going into a new trading range roughly between the 2014 low and the 2015 high, my bet is on higher corn prices to move the gold/corn ratio closer to a mean reversion. Be careful out there! Disclosure: The author is long CORN, GLD. (More…) The author wrote this article themselves, and it expresses their own opinions. The author is not receiving compensation for it (other than from Seeking Alpha). The author has no business relationship with any company whose stock is mentioned in this article. Are you Bullish or Bearish on ? Bullish Bearish Neutral Results for ( ) Thanks for sharing your thoughts. Submit & View Results Skip to results » Share this article with a colleague

Agribusiness ETFs: Commodity Slump Pressures Farmers

Summary Depressed commodity prices are hurting farmers. As farmers’ profits fall, the agribusiness industry could slow. Overview of current agriculture industry. Agribusiness exchange-traded funds could experience stunted growth as depressed grain prices squeeze farmers’ profit margins. Over the past year, the Market Vectors Agribusiness ETF (NYSEARCA: MOO ) rose 7.7% and the PowerShares Global Agriculture Portfolio ETF (NASDAQ: PAGG ) increased 7.6% higher. “U.S. farmers are beginning to cut back on farming equipment as the low crop prices and rising costs diminish income,” reports Alan Bjerga for Bloomberg . The U.S. government projects that farm income this year is heading toward the third consecutive decline and will post its largest fall since the Great Depression. Net-cash income from farm activity is expected to plunge 22% to $89.4 billion, the biggest drop off since 1932. For instance, Illinois grower Jason Lay stated that he will purchase 30% less fertilizer for 2,500 acres of corn and soybeans, 7% fewer seeds for spring planting and no new equipment, with crop futures now trading near a five-year low. “You spend when times are prosperous so you don’t need to when they’re not,” Lay said in the Bloomberg article. “That’s how you make it through.” Over the past year, the Teucrium Corn ETF (NYSEARCA: CORN ) has declined 17.0% and the Teucrium Soybean Fund (NYSEARCA: SOYB ) fell 14.1%. “The U.S. Department of Agriculture has predicted lower-than-expected U.S. corn stockpiles next year of 1.827 billion bushels, down from 1.877 billion, but raised its global stockpile projections to 189.6 million metric tons from 189.2 million,” reports Jesse Newman for the Wall Street Journal . “Combined grain supplies are substantial, and the market will not shift attention to the spring-planting progress and crop development across the Northern Hemisphere,” Jerry Gidel, the chief feed-grain analyst at Rice Dairy LLC, said in a Bloomberg article. Market Vectors Agribusiness (click to enlarge) Max Chen contributed to this article . Disclosure: The author has no positions in any stocks mentioned, and no plans to initiate any positions within the next 72 hours. (More…) The author wrote this article themselves, and it expresses their own opinions. The author is not receiving compensation for it. The author has no business relationship with any company whose stock is mentioned in this article.