Tag Archives: seeking-alpha

Cash: The Forgotten Asset Class

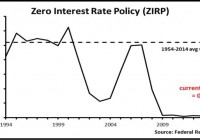
Summary Many responsible for portfolio construction forget the important role that cash plays in an overall investment portfolio. Cash plays several roles given divergences in the economic data and environment the investor is operating in, but I believe, some level of cash should be kept in all environments. Currently investors are earning close to 0% on cash, and alternative investments for cash are explored. Many investors have lamented at the lack of investment options for excess cash, and with good reason. Since the Fed began their extraordinary monetary policy which has included interest rates at the zero lower bound, savers have been deprived of a reasonable rate of interest on their cash savings. Most bank accounts currently pay 0.01%. This begs the question where should savers put their cash to earn a reasonable rate of return, while preserving the safety of principal? While there are few places to get the traditional 5% money market of the pre financial crisis era, there are several options for investors to park their cash to earn additional alpha. (click to enlarge) Reasons to Keep Cash The common theme on Wall Street is to have as little cash as possible. Today, many financial gurus are telling investors to keep 100% equity portfolios, as many expect the Fed to raise interest rates, and have instilled unnecessary fear into investors’ minds about bonds. As we will explore there are many reasons investors can, and should, keep cash on hand. Keeping Cash to Stay the Course As I discussed in my piece, the key to long term investment success keeping a certain percentage of ones assets in cash allows investors to stay the course in investing. As the financial crisis has shown many investors routinely say they can handle more risk than they can in a real life scenario. This disconnect between risk tolerance, the attitude towards risk, and risk capacity, the ability to actually withstand risk, is the reason that all too often an investor is their own worst enemy as they take money out of risk assets at the first hint of trouble. By keeping more safe assets on hand, investors can ride out the storms of the market and reach their long term investing goals. Keeping Cash to Take Advantage of Market Opportunities Market draw downs are not fun for the average investor. But as Bruce Berkowitz of Fairholme Capital says, market declines set up the environment for future outperformance. In addition to staying the course in the pursuit of achieving ones long term investment goals, having cash on hand, allows investors to take advantage of rock bottom prices on risk assets when the time is right. Yet another reason why the advice of the crowd, staying fully invested in equities, makes little sense. Keeping Dollar Bills in a Deflationary Environment In a deflationary environment, the value of the dollar increases in buying power. An investor keeping cash may be earning little return on their cash in the form of interest but is earning a great return in the real economy, as every dollar is worth more and more in buying power. As you can imagine this works the other way when we are talking about debt. In a deflationary environment, debt holders are strangled as every dollar owed increases in value. Keeping cash piles high and debt burdens low is imperative to profiting in a deflationary environment. An Overview of the Current Economic Environment In order to understand cash as an investment we have to first understand the current economic environment. This allows us to understand the role cash plays within the current context of portfolio construction. As I stated in The Key to Investment Success , holding cash and U.S. Treasury Securities, which are one in the same, is imperative to achieving ones long term investment objectives. However, the amount of cash held is subject to an analysis of the economic environment. Currently, the economic data continues to worsen it seems with virtually every data release from around the globe. Two weeks ago Singapore was expecting a positive increase to GDP of 0.8% instead GDP fell sharply at a rate of 4.6%. Just this past week we learned that South Korea has had its slowest GDP growth in six years. The challenges in China with slowing GDP growth and crashing stock markets are bringing even more uncertainty to the forefront. The debt crisis in Greece, and the continued over indebtedness of the Eurozone, and the United States continues to provide a drag on GDP that no one seems to be doing anything about. The data stateside is not bringing much confidence to the market place that our economy is capable of handling the eagerly anticipated rise in interest rates that the street has told us is coming as early as September. (click to enlarge) (click to enlarge) (click to enlarge) Velocity on M2 remains at a 50+ year low, u-6 unemployment remains elevated at 10.5%, the PCE, the Fed’s preferred measure of inflation, remains below the target of 2%, commodities are falling precipitously, and productivity in the U.S does not look good. We are nearly seven years into a recovery and yet the U.S continues to grow at an anemic 2.2% average. In my recent piece, Don’t Ignore The Weakness in Commodities , I argued that the slip in commodity prices is really indicative of a worldwide slowdown in economic growth, and rising deflationary forces. As both the public and private spheres are taking on more and more debt, there is simply less demand for goods and services. With this lack of demand and oversupply, we are seeing prices decline. In this type of economic environment holding sufficient levels of cash, and even being overweight cash and cash equivalents, such as U.S Treasury Bonds, is a prudent investment strategy in my opinion. Alternative Investment Strategies to Boost the Return on Cash There are many alternatives to boost the return on cash, but first we must remember that the objective of the cash sleeve of a portfolio is to provide stability and return OF our capital not to maximize return ON our capital. With that in mind here are three strategies to maximize the return on cash. Active Management Short Term Funds Some investors should consider the benefits of actively managed short term funds such as the PIMCO Enhanced Short Maturity Strategy ETF (NYSEARCA: MINT ). MINT is a fund that holds bonds with durations that generally do not exceed one year, with the objective of enhancing the return on capital to be greater than a money market fund. Currently MINT boasts a 1.64% yield to maturity, and an SEC yield of 0.73%. However it does carry an expense ratio of 0.35%, which I would consider a bit steep for a place to park cash. Mutual fund alternatives may be the Dodge & Cox Income Fund (MUTF: DODIX ) or the Fidelity Tax Free Bond Fund (MUTF: FTABX ) for taxable account investors. U.S. Treasury Securities My perennial favorite place to park cash is in U.S. Treasury securities, which can be bought in a variety of maturities allowing the investor to lock in higher rates for a longer period of time in a declining rate environment, or give them the opportunity to reinvest maturing securities at higher rates in a rising rate environment. In the current environment, I continue to be partial to the long term Zero Coupon U.S. Treasury bond, which I think holds a tremendous amount of value at current levels, and will likely benefit from the macroeconomic environment within which we find ourselves. I prefer individual bonds with maturity dates to lock in principal plus interest and a defined date of maturity. But for those who prefer ETFs the Vanguard Extended Duration Treasury ETF (NYSEARCA: EDV ) and the PIMCO 25+ Year Zero Coupon U.S. Treasury Index ETF (NYSEARCA: ZROZ ) are two options at the long end, and the PIMCO 1-3 Year U.S. Treasury Index ETF (NYSEARCA: TUZ ) and the PIMCO 3-7 Year U.S. Treasury Index ETF (NYSEARCA: FIVZ ) at the short end and belly of the curve respectively. Understand however, that owning ETFs instead of bonds with maturity dates, does expose investors to a greater amount of risk, and is not recommended for cash. Buying the U.S. Dollar A slightly more risky strategy is to buy the U.S. dollar in the currency market. If you are not a financial professional, there are several ETFs such as the PowerShares DB USD Bull ETF (NYSEARCA: UUP ) or the WisdomTree Bloomberg U.S. Dollar Bullish ETF (NYSEARCA: USDU ). Within the current economic environment, the U.S. seems to be the only country not trying to devalue their currency. Japan, as well as the entire Eurozone, and others continue to engage in policies that seek to devalue their currencies, thus making their goods cheaper. The currency wars are raging, and so is the U.S dollar’s value. In this environment, I expect the U.S dollar to continue its move upwards. Paying off Debt While not an overt place to stash your cash, paying off debt, especially within the context of investment leverage, will go a long way in ensuring investors meet their long term goals, and that they can survive hard times economically. As I stated above in a deflationary environment which I believe we are in globally, every dollar of debt strangles, while every dollar held gains value. The more dollars that can be averted from future debt payments allows the investor to take advantage of rock bottom prices in risk assets, as well as in the broader economy. Cash is king. Brokered CDs Brokered CDs are largely similar to the CDs you will find at your local bank. Many of them can be found through your broker, and offer yields as high as or higher than Treasury bonds in some cases. While I would not personally follow this course of action, it may be right for some investors, and deserves consideration. Conclusion In conclusion, the role of cash has largely been forgotten by many responsible for portfolio construction. I believe cash is an important asset class that is not to be ignored when times are good. In this piece we have explored some of the reasons to keep a steady allocation to cash, and where in the current economic environment to get a greater return on cash. In the end, if my assessment of the economic environment is correct, those with cash will be able to profit in a world of deflating prices. Disclosure: I am/we are long UUP, LONG TERM ZERO COUPON U.S. TREASURY BONDS. (More…) I wrote this article myself, and it expresses my own opinions. I am not receiving compensation for it (other than from Seeking Alpha). I have no business relationship with any company whose stock is mentioned in this article. Additional disclosure: This article is for informational purposes only and is not an offer to buy or sell any security. It is not intended to be financial or tax advice, and it is not financial or tax advice advice. Before acting on any information contained herein, be sure to consult your own financial or tax advisor.

CEFL Now Yielding 23% – What’s Wrong With The Closed-End Funds?

The decline in closed-end funds has now reduced the total return on CEFL to a negative 5.2%. That decline has brought he yield on CEFL to 23% on an annualized monthly compounded basis. The decline in the closed-end funds overestimates both the possible impact that an increase in interest rates should have on the closed-end funds and the likelihood of the rate increase. The 12.9% discount to book value of the closed-end funds in the index upon which CEFL is based also makes CEFL attractive at present levels. Of the 30 index components of UBS ETRACS Monthly Pay 2xLeveraged Closed-End Fund ETN (NYSEARCA: CEFL ), 29 now pay monthly. Only the Morgan Stanley Emerging Markets Domestic Debt Fund (NYSE: EDD ) now pays quarterly dividends in January, April, October, and July. Thus, only EDD will be not included in the August 2015 CEFL monthly dividend calculation, while the 29 others will. My calculation using all the 29 components which are expected to have ex-dividend dates in July 2015 projects a August 2015 dividend of $0.2973. None of the closed-end funds in the index have changed their dividends. Thus, the decline in the CEFL monthly dividend is primarily due to the reduction in the indicative or net asset value of CEFL. The indicative value of each CEFL share has decreased about 4.5% from June 30, 2015, to July 24, 2015. Only 29 of the 30 CEFL closed-end fund components also had ex-dates in April 2015, so the May 2015 dividend was also based on 29 of the 30 components. From April 30, 2015 to July 24, 2015 the indicative or net asset value of CEFL has declined from $22.801 to $18.9324 a decline of 17.0% As I explained in MORL Dividend Drops Again In October, Now Yielding 21.5% On A Monthly Compounded Basis, if the dividends on all of the underlying components in a 2X leveraged ETN, such as CEFL, were to remain the same for a specific month, but the indicative value (aka net asset value or book value) was lower, the dividend paid, which is essentially a pass-through with no discretion by management, would also decrease by about half as much. This is the result of the rebalancing of the portfolio each month required to bring the amount of leverage back to 2X. Of course, an increase in indicative value would result in a corresponding increase in the dividend. The problem with CEFL is that the market prices of the closed-end funds in the index have declined precipitously, especially in recent weeks. The total return on CEFL from the closing price of $27.03 on January 7, 2014, the first day of trading, to the July 24, 2015 price of $18.71, taking into account the $6.915 dividends paid over that period, is now -5.2%. That does not take into consideration any income that might have been earned by reinvesting the dividends nor any losses that could have been incurred if the dividends had been reinvested in additional shares of CEFL. As recently as July 16, 2015 the total return since inception for CEFL had been positive. The decline in the prices of the 30 closed-end funds upon which CEFL is based seems to be part of the flight from all things that could be hurt by higher interest rates, which could accompany improving economic activity. In an article, X-Raying CEFL (Part 3): Interest Rate Sensitivity , published June 23, 2015, Seeking Alpha contributor Stanford Chemist presents well supported arguments as to why CEFL “is not very interest rate sensitive, and investors therefore do not have to unduly worry over the effect of increasing interest rates on CEFL.” However, at this moment, especially during the last few weeks, the markets do not seem very interested in any well supported arguments regarding the effects on closed-end funds of possibly higher interest rates. This seems to be the case even though the security that would absolutely be impacted by higher interest rates, the 10-year US treasury bond has not moved much during that period. My original interest in CEFL resulted from an attempt to benefit from my view that interest rates would remain low for a long period when many were predicting the exact opposite. I wanted to collect the high income that would result from effectively borrowing at very low short-term rates to finance higher yielding securities. The obvious choice for an investor who believes that interest rates would remain low for a long period, but cannot or does not want to take the margin call risk associated with: swaps paying floating and receiving fixed, interest rate futures or borrowing money to finance securities on margin, would be inverse floaters. Unfortunately, due to the media vilification and the persecution by regulatory agencies of financial institutions that invested in agency inverse floaters in the 1990s, I as a retail have been unable to buy any inverse floaters. See: Are mREITS The New Inverse Floaters? After not being able to find any inverse floaters, I looked for the next best thing. An inverse floater is usually an instrument that takes a pool of fixed income securities and divides it into two tranches. For example you could start with $10 million of fixed-income securities paying a 4% coupon, You would use those securities to issue $9 million floating rate securities that might pay LIBOR +1%. Then, the other $1 million would be an inverse floater that paid 31.0% – 9 x Libor. Thus if LIBOR was .25%, as it has been for the last few years. The floating rate note would pay 1.25% and the inverse floater would pay 28.75%. This would mean that the $400,000 annually paid by the $10,000,000 fixed income securities with the 4% coupon would be divided with $112,500 going the floating rate security holders and the remaining $287,500 going to the inverse floater holders. Typically, the rates would be adjusted monthly with LIBOR. Thus, the inverse floater holders are bearing the interest rate risk. The principal payments made by the $10,000,000 in fixed-income securities are passed through to the holders. Thus, the holders of the inverse floater will absolutely receive their principle back at some point. However, they bear the risk that if LIBOR interest rates rise high enough their coupon will be zero for some period. There never can be a margin call. An institution or large investor who could borrow at LIBOR + 1.0% could emulate the return on the inverse floater by buying the same $10,000,000 in fixed income securities and financing $9,000,000 it at LIBOR + 1.0%. Today, institutions can finance such securities at about LIBOR making the income from such a carry trade even more lucrative. However, a major difference between owning an inverse floater and buying the same underlying security on margin is that if the value of the underlying securities falls below a certain point, you can have a margin call. Mutual funds are not allowed to borrow more than 33% of their assets. A mutual fund that simply owned fixed-income securities and borrowed 33% would not be much of an improvement over just owning the fixed-income securities outright, after the mutual fund fees and expenses are considered. Ideally, I would have liked to find a mutual fund that owned a significant amount of inverse floaters. I still would. One investment vehicle that is not limited as to its’ borrowing and leverage in an mREIT. The Securities and Exchange Commission is not too happy with what they consider a loophole and have at times made some noise about regulating the amount of borrowing and leverage in mREITs. However, that would involve taking on the powerful real estate lobby. So action by the Securities and Exchange Commission in regard to mREIT leverage is not likely any time soon. On the surface, an mREIT that buys agency mortgage backed securities using leverage via repurchase agreements looks a lot like an inverse floater. Actually, using the example of an agency mortgage backed security with a 4.0% coupon using 9-1 leverage, since an mREIT can borrow at close to LIBOR rather than LIBOR + 1% that was assumed in the inverse floater example, its yield would even more. With LIBOR at .25%, the inverse floater would pay 28.75% while the agency mREIT would pay 37.75% less any non-interest mREIT expenses. From an investor’s viewpoint the biggest drawback in terms of agency mREITs as opposed to inverse floaters is that with agency inverse floaters you will receive the full face value at some point. Agency mREITs must mark their borrowings to market and thus will receive a margin call if the value of the underlying agency mortgage backed securities declines beyond a certain point. In an attempt to avoid the possibility of a margin call or even forced liquidation, the mREITs use various hedging strategies. I would prefer an mREIT that employed no hedging but reduced risk with less leverage. An mREIT with only 4 to 1 leverage and no hedges would have paid double-digit dividends in each of the last seven years and not have lost any share price. It would have declined in value during the taper tantrum but would have fully recovered in price and then some by today. Despite my apprehension over the fact that mREITs did not guarantee ultimate return of 100% of face value, as agency inverse floaters would, I started buying mREITs based on my view that interest rates would remain low for much longer than many market participants believed. Logically, if interest rates were to remain low, there should not be that much risk that agency mREITs would decline in value. When the UBS ETRACS Monthly Pay 2x Leveraged Mortgage REIT ETN (NYSEARCA: MORL ) was created in October 2012, it looked like an even better way to bet on my view that interest rates would remain low. MORL is structured as a note and thus circumvents the regulation that limits mutual fund leverage to only 33%. With very low borrowing costs, MORL would be paying almost twice as much in dividends than the weighted average of the mREITs that comprised the index upon which MORL is based. As long as the value in the mREITs did not decline significantly, the 2X leverage of would not be a problem. When CEFL was created it also looked like a good way to benefit from a continuation of low interest rates. CEFL, also structured as a 2X leveraged note, had the benefit of not being tied to the mortgage markets the way that MORL was and thus generating almost as high a yield while providing diversification. Later I added the ETRACS 2xLeveraged Long Wells Fargo Business Development Company ETN (NYSEARCA: BDCL ) for the same reasons. The problem is that the prices of the 30 closed-end funds upon which CEFL is based have declined. I had implicitly considered the closed-end funds to be proxies for fixed-income securities. In some respects a portfolio of 30 closed-end funds chosen by a formula that more heavily weights those with the highest yields and greatest discounts to book value seemed possibly better than ordinary bonds. However, that has not been the case. A simple portfolio of buying treasury bonds on margin, if the borrowing cost was the same low rate that CEFL implicitly uses, would have had a very good positive return from on January 7, 2014, the first day of CEFL trading to July 24, 2015. There have been numerous problems plaguing the individual closed-end funds upon which CEFL is based. Some have investments in the energy sector which have declined with oil prices. However, it seems to be fear of rising rates that has had the greatest impact. Beyond the argument that CEFL should not be very sensitive to interest rates, which the market seems to be rejecting, my view is that the market is also overestimating the probability that the Federal Reserve will be aggressive in raising rates. The most succinct way that I can express my view on the outlook for interest rates is that the Federal Reserve has many reasons not to raise rates. The economy is now showing modest growth with tepid inflation. The reason why we now have the current modest growth rates and tepid inflation as compared to negative growth and deflation is primarily due to the policy of the Federal Reserve since 2008. Over the past few years, fiscal policy has had very little impact on the economy. If anything, the reduction in federal deficits and thus fiscal thrust has been a headwind to economic growth. The Federal Reserve low rate policy is the reason why economic conditions are what they are now. It makes no sense to risk a return recession by raising rates. One of the reasons why I am still constructive on CEFL is the 12.9% weighted average discount to book value of the components that comprise the index upon which CEFL is based as of July 25, 2015. This is a relatively large increase in the discount that I measured last month of 11.1%. Three months ago CEFL had a 8.6% weighted discount to book value. Thus, in just three months the discount has increased from 8.6% to 12.9%. If the discount to book value of the components that comprise the index upon which CEFL is based was still 8.6%, the total return on CEFL since inception would still be positive. The weighted average discount is determined by taking the price-to-book value for each of the closed-end funds that comprise the index and multiplying it by the weight of each component. The sum of the products is 87.1%. None of the 30 closed-end funds in the index are currently trading at a premiums to net asset value. Last month there were two CEFL components trading at premiums. The AGIC Convertible & Income Fund II (NYSE: NCZ ) with a weight of 1.43% had a price-to-book ratio of 1.041. The AGIC Convertible & Income Fund (NYSE: NCV ) with a weight of 2.28% had a price-to-book ratio of 1.016. Now both are trading at discounts. This can be seen in the table below that shows the weight, price, net asset value, price to net asset value, ex-dividend date, dividend amount, frequency of the dividend, contribution of the component to the dividend and the amount if any of the dividend included any return of capital for each of the closed-end funds in the index. The 12.9% discount makes CEFL more attractive. The discount also makes CEFL a better investment than buying the individual securities that are included in the portfolios of the closed-end funds yourself in a margin account at 50% leverage to replicate CEFL. Even if you could borrow at less than 0.90% that the CEFL tracking fee plus the current LIBOR rate approximately equals, the discount on the CEFL components makes buying the funds rather than the individual securities a superior investment. This large discount to net asset value alone is a good reason to be constructive on CEFL. It should be noted that saying CEFL components are now trading at a deeper discount to the net asset value of the closed-end funds that comprise the index does not mean that CEFL does not always trade at a level close to its own net asset value. Since CEFL is exchangeable at the holders’ option at indicative or net asset value, its market price will not deviate significantly from the net asset value. The net asset value or indicative value of CEFL is determined by the market prices of the closed-end funds that comprise the index upon which CEFL is based. While the 2014 year-end rebalancing has reduced the monthly CEFL dividend, it is still very large. For the three months ending August 2015, the total projected dividends are $0.9769. The annualized dividends would be $3.9076. This is a 20.9% simple annualized yield with CEFL priced at $18.71. On a monthly compounded basis, the effective annualized yield is 23.0%. Aside from the fact that with a yield above 20%, even without reinvesting or compounding you get back your initial investment in only 5 years and still have your original investment shares intact, if someone thought that over the next five years markets and interest rates would remain relatively stable, and thus CEFL would continue to yield 23% on a compounded basis, the return on a strategy of reinvesting all dividends would be enormous. An investment of $100,000 would be worth $281,587 in five years. More interestingly, for those investing for future income, the income from the initial $100,000 would increase from the $23,000 initial annual rate to $64,765 annually. CEFL components as of July 24, 2015 Name Ticker Weight Price NAV price/NAV ex-div dividend frequency contribution return of capital Clough Global Opportunities Fund GLO 4.56 12.26 14.2 0.8634 7/15/2015 0.1 m 0.01408   First Trust Intermediate Duration Prf.& Income Fd FPF 4.53 21.77 24.03 0.9060 7/1/2015 0.1625 m 0.01280   Eaton Vance Tax-Managed Global Diversified Equity Income Fund EXG 4.51 9.75 10.37 0.9402 7/22/2015 0.0813 m 0.01424 0.068 Doubleline Income Solutions DSL 4.47 19.14 21.95 0.8720 7/15/2015 0.15 m 0.01326   Alpine Total Dynamic Dividend AOD 4.42 8.54 10.13 0.8430 7/22/2015 0.0575 m 0.01127   Eaton Vance Limited Duration Income Fund EVV 4.39 13.5 15.63 0.8637 7/9/2015 0.1017 m 0.01252   MFS Charter Income Trust MCR 4.35 8.28 9.69 0.8545 7/14/2015 0.0658 m 0.01310   Alpine Global Premier Properties Fund AWP 4.29 6.31 7.48 0.8436 7/22/2015 0.05 m 0.01287 0.0283 PIMCO Dynamic Credit Income Fund PCI 4.24 19.67 22.78 0.8635 7/9/2015 0.1563 m 0.01275   Blackrock Corporate High Yield Fund HYT 4.2 10.39 12.29 0.8454 7/13/2015 0.07 m 0.01071 0.0012 ING Global Equity Dividend & Premium Opportunity Fund IGD 4.19 7.93 9.05 0.8762 7/1/2015 0.076 m 0.01521   Eaton Vance Tax-Managed Diversified Equity Income Fund ETY 4.16 11.41 12.55 0.9092 7/22/2015 0.0843 m 0.01164   BlackRock International Growth and Income Trust BGY 4.15 7.19 7.75 0.9277 7/13/2015 0.049 m 0.01071 0.0337 Prudential Global Short Duration High Yield Fundd GHY 4.13 14.51 17.04 0.8515 7/15/2015 0.125 m 0.01347   Western Asset Emerging Markets Debt Fund ESD 4.07 14.46 17.51 0.8258 7/22/2015 0.105 m 0.01119 0.0268 Morgan Stanley Emerging Markets Domestic Debt Fund EDD 3.68 8.28 9.98 0.8297 6/26/2015 0.22 q     GAMCO Global Gold Natural Resources & Income Trust GGN 3.6 5.28 6 0.8800 7/15/2015 0.07 m 0.01807 0.07 Prudential Short Duration High Yield Fd ISD 3.25 15.01 17.43 0.8612 7/15/2015 0.1225 m 0.01004   Aberdeen Aisa-Pacific Income Fund FAX 3.23 4.72 5.71 0.8266 7/17/2015 0.035 m 0.00907 0.0143 Calamos Global Dynamic Income Fund CHW 3.17 8.4 9.54 0.8805 7/8/2015 0.07 m 0.01000 0.0161 MFS Multimarket Income Trust MMT 2.92 6 6.97 0.8608 7/14/2015 0.0473 m 0.00871   Backstone /GSO Strategic Credit Fund BGB 2.72 15.31 17.96 0.8524 7/22/2015 0.105 m 0.00706 0.0012 Allianzgi Convertible & Income Fund NCV 2.12 7.31 7.74 0.9444 7/9/2015 0.09 m 0.00988   Western Asset High Income Fund II HIX 2.07 7.06 8.08 0.8738 7/22/2015 0.069 m 0.00766 0.0006 Blackrock Multi-Sector Income BIT 2.04 16.45 19.31 0.8519 7/13/2015 0.1167 m 0.00548   Wells Fargo Advantage Multi Sector Income Fund ERC 1.73 12.4 14.75 0.8407 7/13/2015 0.0967 m 0.00511 0.0283 Wells Fargo Advantage Income Opportunities Fund EAD 1.33 8.04 9.34 0.8608 7/13/2015 0.068 m 0.00426   Allianzgi Convertible & Income Fund II NCZ 1.33 6.69 6.9 0.9696 7/9/2015 0.085 m 0.00640   Nuveen Preferred Income Opportunities Fund JPC 1.2 9.21 10.44 0.8822 7/13/2015 0.067 m 0.00331   Invesco Dynamic Credit Opportunities Fund VTA 0.96 11.49 13.29 0.8646 7/9/2015 0.075 m 0.00237   Disclosure: I am/we are long CEFL, MORL, BDCL. (More…) I wrote this article myself, and it expresses my own opinions. I am not receiving compensation for it (other than from Seeking Alpha). I have no business relationship with any company whose stock is mentioned in this article.

Unloved In The Marketplace, Savvy Senior ‘Income Growth’ Portfolio Increases Cash Flow Payout

“Total return” results have been nothing to brag about for this author and many others focused on income and dividend investing in recent months. But through re-investing and compounding, my 10% yielding portfolio has increased its income flow by 14.7% from a year ago. In other words, the “income factory” continues to expand its output, even while the factory itself has seen its market price drop, making re-investment even more attractive. I would worry if I thought the income factory were worth less in an economic sense, but it is not. A lot of what is spooking markets these days (the Fed, Greece, Puerto Rico, inflation) is just noise. From a total return standpoint, it has been a tough first half in 2015 for many dividend-focused investors, including me. Fortunately, I focus on what my “income factory” produces, and not how the market values it from day to day or month to month. From that standpoint, the news is positive since “factory output” (i.e. income) continues to increase steadily, and I can re-invest that output in additional machines (i.e. income-producing assets) at bargain prices. To be specific, the cash income my factory produced for the first 6 months of 2015 was up 14.7%, higher than the cash income it generated during the first six months of 2014. The six-month cash yield was 5.1% (10.2% annualized) versus a total return that was just barely positive at 0.2%, so without the cash distributions, the return would have been a negative 4.9%. In a practical sense, having a 10% dividend stream that I can re-invest in assets that have essentially been “on sale” for the past nine months is a great opportunity and accounts for my income stream increasing at the rate it has. Since the end of the quarter (June 30), market values have dropped even more, so my current total return year-to-date as we go to press is a bit lower (minus 1%). I mention this in order to compare it to a few useful benchmarks that also report on a year-to-date basis: · Vanguard Dividend Appreciation ETF (NYSEARCA: VIG ): YTD total return of 1.6%, with a yield of 2.24% · Vanguard High Dividend Yield ETF (NYSEARCA: VYM ): YTD total return of -1%, with a yield of 3.26% · ProShares S&P 500 Dividend Aristocrats ETF (NYSEARCA: NOBL ): YTD total return of -.27%, with a yield of 1.85% · SPDR Dividend ETF (NYSEARCA: SDY ): YTD total return -2.32%, with a yield of 2.37% · Vanguard Wellesley Income Fund (MUTF: VWINX ): YTD total Return of -0.4%, with a yield of 2.7% · Vanguard Wellington Fund (MUTF: VWELX ): YTD total return of 1.05%, with a yield of 2.4% In short, it’s been a tough quarter for balanced fund or dividend growth type investors, with mostly flat or slightly down results. The poor total returns are offset, of course, by the ability to compound dividends. But that’s limited if you’re only earning 3% or 4% yields like so many “dividend growth” portfolios. That’s why I’m pretty satisfied at this point with my “income growth” strategy (that many readers are familiar with from past articles, like this one , and this one ) that focuses on growing the income stream through compounding high cash distributions (8-10% or so), and does not rely on organic growth (dividend increases) or market value appreciation. The potential “fly-in-the ointment” in a strategy like mine would be if the decline in market value were a genuine signal of a drop in the income generating potential of a particular asset. So we have to ask the question: · Is the current drop in prices, especially for high-yielding assets like utilities, high-yield credits, and leveraged closed-end funds and other vehicles, a sign that the high yields these assets generate are in jeopardy? · Or are they more a reflection of the “nervous Nelly” quality of the equity markets, where concerns about various issues can translate into selling pressure in unrelated markets and asset classes. I subscribe to the “nervous Nelly” view and believe that markets are seeing negatives that don’t actually exist or are not relevant to the high yield and leveraged markets. Some examples: · Concern about Janet Yellen and the Fed raising interest rates. First of all, when the Fed finally does raise rates, it is likely to only be 50-100 basis points, if that. While that may send a signal that the economy is “normalizing” and that the artificially low interest rate era may be ending, it is hardly enough to hurt leveraged closed-end funds or most other leveraged vehicles. So a closed-end fund that is borrowing at 1% will now have to pay 1½% or 2% instead. If they are using the money to invest in loans, bonds or preferred stock, etc. paying 5%, 6%, 7% or more, it is still a good deal. Meanwhile, the rates on what they are buying will likely go up as well. · All bonds are not created equal. Rising interest rates tend to hurt long-term, fixed-rate, government and investment grade corporate bonds. That’s because these bonds have a relatively high duration and most of the interest coupon an investor receives is payment for taking interest rate risk, not credit risk. High yield bonds, leveraged loans and many other high-yielding instruments often have shorter durations and the coupon represents payment for taking credit risk, not interest rate risk. The irony is that many of these assets actually do better when interest rates increase because the rising rates are a sign of an improving economy, which tends to improve credit performance. Credit performance, rather than interest rate risk, is the main factor in portfolio performance of high-yield bonds and loans. (Loans, by the way, are floating rate, so they have virtually no interest rate risk at all). · Concerns about inflation. In general, I do not see inflation as a medium- to long-term threat the way it was 30 years ago. The main reason is the globalization of our economy, including labor markets. Merely living in a developed country no longer guarantees you a developing country level wage anymore, now that companies can move jobs – actually and virtually – all over the world. This will continue to keep wage inflation down in the United States for years to come. This in turn will have a moderating effect on interest rates. · Other negatives – China’s stock market meltdown, Greece’s economic and political problems, Puerto Rico’s insolvency – may make headlines but are unlikely to affect the ability of the companies in our various fund portfolios to meet their obligations and maintain those funds’ cash flows. So those are the various negatives that I’m NOT particularly worried about. On the positive side, I am happy that the economy continues to make steady forward progress. I don’t need it to race ahead, since I’m not looking to the stock market to appreciate for my strategy to work. I just want the hundreds or thousands of companies whose stock, bonds, loans and other securities are owned by the dozens of funds that I own to keep on paying and continuing to provide the cash flow that my funds distribute. I have not changed my basic portfolio much at all from three months ago, and you can see it in my April article here . A few tweaks included: · Selling off a portion of my Cohen & Steers CEF Opportunity Fund (NYSE: FOF ) when it reached a market high a few months ago. It’s a great fund, and I’ve been buying back in now that it’s at a lower price point and yielding 8.7%. · Started adding Babson Capital Participation Investors (NYSE: MPV ) as a solid “buy once, hold forever” sort of investment. It has been managed by Mass Mutual Insurance since 1988, with an average annual return over that time of over 10%. It holds “private placements” which are the fixed income “bread and butter” of the insurance industry, and Mass Mutual is a long-time professional at it. The shares sell at a 9.7% discount, well below its typical 4% discount, and it pays a distribution of 8.6%. · Added to Reaves Utility Income Fund (NYSEMKT: UTG ) as its price came down and yield went back up to 6.25%, which is high for this excellent fund that many of us here on Seeking Alpha have liked and held for many years. · Added to Duff & Phelps Global Utility Income Fund (NYSE: DPG ); good solid holding in the utility sector; great opportunity right now at almost 14% discount, 8.2% yield. · Added to Blackstone/GSO Long-Short Credit Income Fund (NYSE: BGX ); good solid floating rate loan fund at 14% discount with 7.6% yield; excellent managers. I continue to watch some of my higher volatility holdings like a hawk. Oxford Lane Capital (NASDAQ: OXLC ) and Eagle Point Credit Company (NYSE: ECC ) continue to bounce around price-wise, but still make their regular distributions, with yields of 16.7% and 11.8%, respectively. They both are challenging to analyze and understand, but the bottom line is that both seem to have plenty of cash flow (which in their world of CLO investing is different than GAAP income) to make their dividend payments, so I am happy to have them in my portfolio. All my high-yield bond funds are underwater, but for reasons mentioned earlier in the article, as an asset class they seem to be in no economic danger of not being able to meet their distributions, so I am inclined to hold them. In fact, the improving economy should help them. If I were not already an investor, I’d be buying into the asset class, just as I did in 2008 and 2009. (When there’s blood in the streets, you buy, right?) That’s about it. “Steady as you go,” is my mantra. Keep re-investing those dividends. Disclosure: I am/we are long BGX, MPV, UTG, ECC, OXLC, DPG, FOF. (More…) I wrote this article myself, and it expresses my own opinions. I am not receiving compensation for it (other than from Seeking Alpha). I have no business relationship with any company whose stock is mentioned in this article.