Tag Archives: vwelx

VWELX: This 86 Year Old Fund Is Still An Ideal Choice For Retirement

Summary Vanguard Wellington is the first balanced fund in the U.S. having launched in 1929. The fund has ranked in the top 10% of its Morningstar peer group over the past 5-, 10- and 15-year periods. The fund has a beta of 0.65 compared to the S&P 500 while outperforming the index over the long term. Wellington held up remarkably well during the 2000 and 2008 bear markets. In a world where there are literally thousands of funds and ETFs available that cover almost every niche, sector and style available, sometimes it’s the most tried and true investment vehicles that still remain the best choices. In the case of the Vanguard Wellington Fund (MUTF: VWELX ), we’re talking about literally the oldest balanced mutual fund in the country. Launched all the way back in 1929, Wellington looks to maintain a balance of roughly two-thirds of assets in conservative large cap stocks and one-third of assets in a mix of high quality bonds. It’s this type of asset allocation that makes for an ideal core holding in many retirement portfolios. Historically, Wellington has provided exactly what retirement investors should be seeking – above average returns with below average risk. With a current beta of 0.65, you’d expect the fund to return about two-thirds of the SPDR S&P 500 Trust ETF’s (NYSEARCA: SPY ) return but over the past 20+ years that hasn’t been the case. VWELX Total Return Price data by YCharts Looking at the past 2+ decades of history is especially appropriate because it takes into account both bull and bear market environments. The fund has performed about how one would expect – outperforming the S&P 500 in a down market but trailing in an up market. The fund’s risk minimization strategy proved especially effective during the Nasdaq bubble providing a relatively steady market performance given the economic environment. While the chart above doesn’t illustrate Wellington’s performance during the financial crisis particularly well but you can see below how well the fund held up. VWELX Total Return Price data by YCharts While the S&P 500 dropped around 55% from its 2007 peak, Wellington was down about 35%. That’s roughly what you’d expect considering the fund’s 60/40 allocation but the fund’s long term performance has been exceptional. Over the last 10 years, the overall performance of Wellington and the S&P 500 has been almost identical. Using a more apples to apples comparison, Wellington has also outperformed the Vanguard Balanced Index Fund (MUTF: VBINX ) – a fund with a 60/40 stock and bond allocation – during the same 10 year period. Morningstar drops Wellington into the Moderate Target Risk bucket. While the fund has returned 8.2% per year since the fund’s inception, it has consistently ranked at the top of its peer group. Wellington ranks in the top 6% of its peer group over the past 5-year and 10-year periods and ranks in the top 4% in the past 15-year period. It’s this type of risk-managed performance history that retirement investors should be seeking out. Retirement income investors will also appreciate the fund’s 2.43% yield. The fund has a few dividend champions among its equity holdings and the bond holdings are almost entirely high quality corporate and Treasury securities ensuring that the fund’s dividend is secure and reliable. Conclusion I’m a firm believer that in the case of most retirement investors, simpler is better. Sophisticated investors may feel comfortable building a more complex portfolio using stock, sector ETFs, etc. but for those who want an all-in-one long term holding that they can just establish and forget about, it’s hard to imagine someone doing much better than Vanguard Wellington. The combination of strong long term performance, risk minimization and low costs make this an ideal core retirement holding even if it’s not as exciting as some of the newer niche products hitting the market today.
Those Are Your Favorite Dividend Growth Funds? Try This One Instead

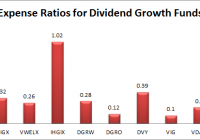
Summary SCHD feels like it doesn’t get much coverage in the dividend investing world, but it is one of the best ETFs in the space. SCHD offers the lowest expense ratio and the one of the better distribution yields. When I was browsing a list by Morningstar, I noticed they were not very interested in the expense ratios or the distribution yields. A few charts showing expense ratios and dividend yields may help you analyze which ones would make sense for you. It seems like the Schwab U.S. Dividend Equity ETF (NYSEARCA: SCHD ) is never in the news. That isn’t a bad thing, but is interesting when I look at some of the ETFs that are getting mentioned by big companies. I recently ran across an article on Morningstar that left me a little curious. The author, apparently speaking for Morningstar, was giving their take on “Our Favorite Dividend Growth Funds and ETFs.” She is a director of personal finance and the author of a book on how to succeed when investing in mutual funds . If anyone should understand the importance of low expense ratios and high distribution yields, she would have the background for it. Of course, I don’t know her and have no grudge, but I was hoping for higher quality when Morningstar decided to publish it. The article included the following funds: T. Rowe Price Dividend Growth Fund (MUTF: PRDGX ) Vanguard Dividend Growth Fund (MUTF: VDIGX ) Vanguard Wellington Fund (MUTF: VWELX ) Hartford Dividend and Growth Fund (MUTF: IHGIX ) WisdomTree U.S. Dividend Growth ETF (NASDAQ: DGRW ) iShares Core Dividend Growth ETF (NYSEARCA: DGRO ) iShares Select Dividend ETF (NYSEARCA: DVY ) Vanguard Dividend Appreciation ETF (NYSEARCA: VIG ) Vanguard Dividend Appreciation Index Fund (MUTF: VDAIX ) It did not include SCHD, which I think should have been one of the top contenders. Let’s talk about the things that actually matter when comparing ETFs with similar investing goals. Remember that this is a discussion of dividend funds, so allocations may be different but there should be quite a bit of overlap. Expense Ratios The expense ratios on an ETF (or mutual fund) are one of the very first things an investor should consider. When I’m considering funds for my portfolio a high expense ratio is pretty much an automatic rejection. When buying an ETF you are making the assumption that the market is reasonably efficient and that your best bet for limiting your risk and finding success is to diversify your investments. If you don’t believe that to at least some extent then there is no reason to invest in either unless it was a requirement of an attractive retirement plan. The point is simple. Expense ratios literally eat your investment. The only reason to pay the expense ratio rather than to buy the individual stocks is for the benefit of being able to buy them all at once with less work and fewer transaction charges. Some investors may be willing to pay a high premium to acquire the most talented that is running “the best” fund. However, the premise that an individual investor can determine which manager will be most successful without ever meeting the manager is absurd. I’m not a believer in the market being perfectly efficient. I cover small cap mREITs and the price movements I’ve seen have convinced me that the small cap companies in the sector are anything but indicative of an efficient market. That is precisely the reason I choose to focus so much of my analysis on a small corner of the market. When a market is small it is expected to have significantly more opportunities for superior analysis because there are fewer experts in the field searching for a market failure. How often were expense ratios mentioned? Only once in identifying one of the reasons VIG was a top choice. The actual expense ratios were not stated for any of the funds. Since those expense ratios matter, I built a chart to display them: As you might guess, I’m fairly partial to SCHD and VIG as my choices for the best dividend growth funds. Distribution Yield Even though the market regularly moves up, many investors find themselves significantly underperforming the S&P 500. One major reason that actual realized returns for investors frequently underperform the market (besides expense ratios) is that as a group investors are terrible at knowing when to buy and sell. If investors as a group regularly understood when to sell, the market would be absurdly stable and herd mentalities would be avoided. I’m not giving myself some kind of self-serving analyst credit there either. Analysts aren’t good at calling the bottom or the top of the markets either. When it comes to winning by market timing, the best solution is to not play the game. Focus on buying ETFs but not selling them. If an investor is simply using a buy and hold strategy for the core of their portfolio the worst they can do is buy at a market top. One of the reasons for using a dividend growth portfolio is that the investor can hopefully live off the dividends eventually. Being able to do that encourages them to avoid selling their shares when the market crashes. I don’t know when the next crash will happen, but I’m fairly confident that most of us will live to see it. The last thing I would want is to be selling off the portfolio during the crash. This is a human error. It is not something intrinsic to the stocks or the ETF that holds them. It is a human mistake that panic leads to a sell off. Being able to live off the dividends prevents that mistake. Living off the dividends requires a stronger distribution yield. The distribution yields were mentioned zero times in the article on Morningstar, but I think they are very important for encouraging good investor decisions. Here is a chart of the expense ratios: Conclusion SCHD has the lowest expense ratio and the second highest distribution ratio. How can anyone skip past SCHD when consider dividend growth ETF investments? On the other hand, IHGIX had a very high expense ratio (over 1%) and a low distribution yield. That does not automatically make it a terrible investment, but it would concern me and certainly deserves to be mentioned when the stock is being suggested as one of the “favorites” for the dividend growth space. When I looked at the prospectus I noticed there were some fairly hefty charges on buying into the fund as well including a very nice dealer commission. No thanks, IHGIX is clearly not for me. For the investors that want to pick a dividend growth ETF, it would be wise to start with determining precisely what you want out of the fund. I always start with low costs. That means a low expense ratios and a preference for free to trade. If you’re convinced that you can handle selling small amounts off to create your own dividend yield without buying into a full scale panic, then distribution yield won’t be as important. I don’t think that dividend stocks are inherently better, but I think many investors would benefit by being protected from themselves. Perhaps the question should be, if an investor does not find dividend growth stocks superior and does not mind selling off portions of their portfolio, why would they be searching for a dividend growth ETF in the first place? Disclosure: I/we have no positions in any stocks mentioned, but may initiate a long position in SCHD over the next 72 hours. (More…) I wrote this article myself, and it expresses my own opinions. I am not receiving compensation for it (other than from Seeking Alpha). I have no business relationship with any company whose stock is mentioned in this article. Additional disclosure: Information in this article represents the opinion of the analyst. All statements are represented as opinions, rather than facts, and should not be construed as advice to buy or sell a security. Ratings of “outperform” and “underperform” reflect the analyst’s estimation of a divergence between the market value for a security and the price that would be appropriate given the potential for risks and returns relative to other securities. The analyst does not know your particular objectives for returns or constraints upon investing. All investors are encouraged to do their own research before making any investment decision. Information is regularly obtained from Yahoo Finance, Google Finance, and SEC Database. If Yahoo, Google, or the SEC database contained faulty or old information it could be incorporated into my analysis.

Vanguard Wellesley Income Fund: The Reverse Of Wellington

Having written about VWELX, a reader asked my take on sister fund VWINX. The two are pretty much the reverse of each other. That, in the end, winds up being a risk issue for potential investors. A lot of investors look at bonds as a way to generate income. And that’s true. But in an asset allocation model, they are also a way to provide diversification and stability. In other words, a big part of owning bonds is safety. And that’s where a comparison of value-focused Vanguard Wellesley Income Fund (MUTF: VWINX ) and Vanguard Wellington Fund (MUTF: VWELX ) leads to some interesting findings. One down, now for number two I recently wrote an article about Vanguard Wellington . Within the comments, a reader asked if I would also take a look at sister fund Vanguard Wellesley. The comparison of the two is actually pretty interesting and highlights an important aspect of investing: risk. Wellington’s portfolio goal is to actively invest in stocks and bonds with a mix of roughly two-third stocks and one-third bonds. There’s a band around those percentages since it’s an actively managed fund, but it generally keeps pretty close to its goals. Sister fund Wellesley’s goal is the mirror image, one-third in stocks and two-thirds in bonds. And what that means for performance is very important. For example, as you might expect, Wellington outperforms bond-heavy Wellesley over the trailing one-, three-, five-, 10-, and 15-year periods through June on an annualized total return basis. That said, over the longer periods, the numbers start to get pretty close. There’s just 30 basis points or so separating the two funds over the 15-year period and around one percentage point over the trailing decade. But, the trend is intact, the fund with more stocks does, indeed, do better on an absolute basis. Interestingly, the income both funds generate is pretty close, too. Wellesley’s trailing 12-month yield is a touch under 3%. Wellington’s yield is roughly 2.5%. To be fair, a good portion of that has to do with the current low rate environment. In a different period, with higher interest rates, I would expect Wellesley’s yield advantage to be larger. But what about risk? But return and distributions aren’t the only factors to consider. Bonds are also about risk control. And on that score, these two funds have very different profiles. For example, over the trailing three years, Wellington’s standard deviation, a measure of volatility, is around 5.5. That’s a pretty low standard deviation. However, Wellesley’s number is an even lower 4. For most conservative investors, either of those two figures would be agreeable. Looking out over longer periods starts to show a bigger gap. For example, over the trailing 15-year period, Wellesley’s standard deviation is roughly 6 and Wellington’s is around 9.5. That’s a more meaningful difference. And remember that the two funds had very similar performance numbers over that span. Thus, over the trailing three years, Wellington’s Sharpe ratio of 2, a figure that measures the amount of return relative to the amount of risk taken, outdistances Wellesley’s 1.7. But over the trailing 15 years, those numbers flip, with Wellesley’s Sharpe ratio of 1 outdistancing Wellington’s 0.7 or so. Since performance over that longer term is so close, the big reason for the difference here is risk. Who’s right for what? At the end of the day, the two funds are both good options for conservative investors looking for a balanced fund. The biggest difference is really in the investor’s desire for safety. If the higher bond component in Wellesley will help you sleep better at night, then you should probably go with the more conservative of these two funds. If you don’t find solace in having more bonds in your portfolio, go with Wellington – noting that the choice is likely to lead to a slightly higher risk profile. That said, there’s a caveat. Interest rates are at historic lows. Bond prices and interest rates move in opposite directions. So when rates go down, bond prices go up. That’s been a tailwind for Wellesley for quite some time. If rates start to move higher quickly, however, that could turn into a headwind because as rates go up, bond prices go down. Wellesley’s higher debt component will mean rising rates are a bigger issue for the fund than for its sibling. However, both funds are run by the same management company and have been around a long time. They have dealt with shifting interest rates before. So this is something to keep in mind, but I wouldn’t let it deter me from purchasing either of these two well-run funds if my goal was to own them for a long time. Disclosure: I/we have no positions in any stocks mentioned, and no plans to initiate any positions within the next 72 hours. (More…) I wrote this article myself, and it expresses my own opinions. I am not receiving compensation for it (other than from Seeking Alpha). I have no business relationship with any company whose stock is mentioned in this article.