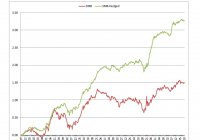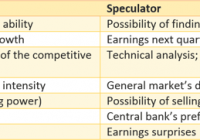
By Baijnath Ramraika, CFA This article originally appeared on advisor perspectives . “Shares are not mere pieces of paper. They represent part ownership of a business. So, when contemplating an investment, think like a prospective owner.” – Warren E. Buffett ” It’s far better to buy a wonderful company at a fair price than a fair company at a wonderful price.” – Warren E. Buffett “The risk of paying too high a price for good quality stocks – while a real one – is not the chief hazard confronting the average buyer of securities. Observation over many years has taught us that the chief losses to investors come from the purchase of low quality securities at times of favorable business conditions.” – Benjamin Graham In the movie The Silence of the Lambs , Dr. Hannibal Lecter helps Agent Clarice find a window to the mind of the killer. He says: First principles, Clarice. Simplicity. Read Marcus Aurelius . Of each particular thing, ask, what is it in itself? What is its nature? When applied to investing in stocks, the pertinent question becomes what is the nature of equity shares. Are they mere entries in one’s investment account or is there more to them? Warren Buffett answered these questions for us when he said that shares represent part ownership of a business . Consequently, he suggested that when investing in equity shares, one should think like a prospective owner. This advice gives rise to further questions. What does it mean to be a part owner of a business ? How does it differ from owning pieces of paper with the intention of flipping them to someone else at a higher price? In the discussion that follows, we will offer our view on those questions and show how investing in equities provides an opportunity to generate superior returns as a part owner of a business. It’s all about the mindset: Part owner or speculator There are key differences between the mindset of a part owner and that of a speculator. While a part owner is chiefly concerned with the future cash-flow generation ability of his business, a speculator is primarily concerned with his ability to sell his holdings to someone else at a higher price, i.e., his ability to find a greater fool. The table below summarizes some of the primary concerns of both kinds of market participants. Exhibit 1: Part-owner vs. Speculator (click to enlarge) Being a part-owner of a business doesn’t mean that you will never sell. However, the decision rules of a part owner are (as they should be) miles apart from those of a speculator. A part owner is much less concerned with day-to-day changes in share prices and much more interested in changes in underlying business value over the long-term. Warren Buffett put it best when he wrote : Buy into a company because you want to own it, not because you want the stock to go up. … People have been successful investors because they’ve stuck with successful companies. Sooner or later the market mirrors the business. In our research paper Long-Term Sources of Investment Returns and a Simple Way to Enhance Equity Returns , we contended that over the long term, investment returns from equities are earned primarily as a result of growth in the underlying business value. This is so because sooner or later, the market mirrors the business. As evidence, we showed that the long-term returns of equity markets have approximated the growth in book value of all businesses. This in turn leads to our assertion that a simple way to generate superior investment return is to invest in a portfolio of high-quality businesses. What is a high-quality (HQ) business? The true nature of an HQ business is rather simple – it has sustainable competitive advantages. Warren Buffett wrote that: The key to investing is not assessing how much an industry is going to affect society, or how much it will grow, but rather determining the competitive advantage of any given company and, above all, the durability of that advantage. The products or services that have wide, sustainable moats around them are the ones that deliver rewards to investors. A business that enjoys sustainable competitive advantages is able to keep competition at bay. As a result, over any extended time period encompassing a full business cycle, such businesses are able to grow their economic earnings. Mirroring this, the business value grows as well. The ability to keep competition at bay manifests itself in measures of economic earnings, specifically in higher returns on capital and superior cash generation especially when adjusted for business-value growth. Superior economic profitability of an HQ business is a result of the existence of competitive advantage and not the other way around. While all businesses with sustainable competitive advantages have the capability to generate superior economic returns on capital, not all businesses that generate superior returns of capital possess sustainable competitive advantages. Quality as an investment factor Quality-driven investing – i.e., investing in shares of HQ companies as an investment strategy – has been around for quite some time. However, it has gained renewed momentum over the past decade driven by spectacular crashes experienced subsequent to the technology boom and during the global financial crisis. Academic research has also revealed the benefits of quality-driven investing. Over the last few years, several academics as well as practitioners have weighed in on the quality factor and many papers have been written to identify object criteria of companies that have it. Further, quality is now being designated by many researchers as a fifth factor explaining investment returns along with beta, size, momentum and value. This development is in sync with our long-held belief that quality is a distinct investment style. This article builds on a number of studies that have explored returns to factors such as profitability, the relationship between accounting, and economic profits and leverage. Chan, et al. (2006) showed that the difference between accounting earnings and cash flows are negatively associated with future returns. George and Hwang (2010) showed that stocks with low leverage have high alpha. Robert Novy-Marx (2013) showed that stocks with high gross profitability as measured by gross profits to assets outperform. We, Baijnath and Prashant (2014), showed that stocks with high returns on equity, superior free-cash-flow and low leverage tend to outperform. In the next section, we will discuss the investment returns from a simple quantitative process of selecting high-quality businesses. In valuing such businesses, market participants systematically underestimate the duration of competitive advantage. Because of this, the valuation premium assigned does not sufficiently account for the difference between the business-value-creation potential of an HQ business as compared to the average business. Indeed, a basket of HQ stocks generates significantly superior investment returns compared to publicly traded benchmarks, and it does so with significantly lower risk. Investment return to high quality stocks in emerging markets This article discusses the application of quality-driven investing in emerging markets. In the discussion that follows, we lay out the framework for selecting HQ businesses and the risk-return of a basket of HQ stocks in emerging markets. 1. Qualitative Factors At Multi-Act, we have spent more than 15 years developing and refining our process for identifying HQ businesses. Our internal research process assigns every company we follow a quality rating, referred to as its “grade.” There are several components of our process, some of which lend themselves to quantitative modeling while others don’t. As discussed above, the defining trait of HQ business is the existence of “sustainable” competitive advantage, a component that does not lend itself to quantitative modeling. The existence and sustainability of competitive advantage are the most important criteria in our classification of a business as HQ. This is driven by our assertion that much of the investment returns that accrue to investors from the quality factor depend on the ability of the business to persist with supernormal returns on capital. This in turn depends on its ability to keep competition at bay. Given our inability to model this component, we believe that our manually selected list of quality businesses will likely generate superior risk-adjusted performance as compared to the quantitatively selected basket that is discussed here. 2. Quantitative factors There are some key characteristics of an HQ business. An HQ business generates superior returns on capital – the stronger the competitive advantage, the lesser the impact of competition and the higher the returns on capital. Returns on capital of such businesses tend to be persistently high. Further, such businesses have a very healthy relationship between their accounting profits and their economic profits. Our HQ businesses possess good balance sheets, so financial risk isn’t a significant factor driving our investment returns or desire to mitigate risk. Exhibit 2: Determination of Quality Companies (click to enlarge) As shown in Exhibit 2 , our process includes three characteristics that lend them to quantitative analysis. Our research process utilizes many measures within each characteristic. For the sake of simplicity, we have chosen one measure to represent each quality characteristic. For the purposes of this article, we measured returns on capital by return on equity (RoE). A high RoE indicates the existence of competitive advantage and the persistence of this variable suggests its sustainability. It is possible for the management of a company to manage its RoE. To the extent that earnings are manipulated, they will impact RoE. Further, RoE is affected by corporate transactions including buybacks, acquisitions and restructurings. To ensure that the earnings component of the RoE is not a result of financial creativity, we use free cash flow over earnings (FCF/EPS) to calibrate the quality of earnings. We have found that this measure filters out companies with suspect accounting numbers. Finally, we measure financial safety by net debt over free cash flow (ND/FCF). This measure indicates the number of years of free cash flow needed to repay the debt. Table 1 provides summary statistics on each of the quality factors by country. Table 1. Comparison of Quality Measures This table shows average quality measures by country for the investment universe as well as for the quality basket. This table reports the average of each country’s equal-weighted average of quality measures between 2005 and 2014. We also report the difference between quality basket and all companies in the selected universe, by country. (click to enlarge) Data and quality factors Our data sample consists of 1,175 companies covering 44 [1] countries between 2005 and 2014. The 44 markets correspond to countries that are not a part of the MSCI World Developed Index as of December 31, 2014. One of the factors affecting the countries included in the study was the market capitalization of the largest company of a country. Those countries which, in any of the last 10 years, did not have a company large enough to be included in the largest 500 companies in the emerging markets space based on market capitalization, are not represented in this study. All data including fundamentals and prices are from Factset Global with returns calculated in USD with currency risk hedged away. We utilized fundamental data reported anywhere in calendar year t-1 in April of calendar year t, such that there is a minimum three-month lag from the end of the fiscal year of the company. Table 2 provides summary statistics on number of companies and market capitalization by country. Table 2. Number of Companies and Market Capitalization This table shows yearly average of number of companies and yearly average of average market capitalization for the investment universe as well as for the quality basket by country. We also report the difference between average market capitalizations of the quality basket and all companies in the universe by each country. (click to enlarge) Given the issues with data availability as well quality of historical data for much of the emerging space, our sample could start in 2005 at the earliest. 3. Methodology Before proceeding with our calculations, we performed exclusions for size and for suitability and data applicability. Every year, we start with the largest 500 companies from all emerging markets after excluding some industries as discussed below. Limiting our universe of companies to 500 companies minimizes size factor’s contribution to our investment returns and ensures that the stocks that qualified through our process were, in fact, tradable. Without this filter, there would indeed be a much larger number of companies over which we would apply the quality factor. Consequently, it is possible that there are differences in the list of HQ businesses between the limited universe of 500 companies and a wider universe. Further, we excluded some industries that do not lend themselves to existence of sustainable competitive advantages [2] in our assessment. This is not to say that there cannot be a business with sustainable competitive advantage in these industries. However, the probability of finding a business with sustainable competitive advantage in these industries is significantly lower. Further, calculating cash-flow data presents a practical problem with some of these industries, especially in the case of banking and insurance where cash flow is affected by changes to loans, investments, and deposits and thus loses its sanctity. Accordingly, we have excluded these industries from our samples. We calculated the quality factors discussed earlier for all the remaining stocks in our data sample. We then applied absolute cutoffs that a business must meet in order to qualify as HQ business. Businesses that met these cutoffs were sorted by their market capitalization in a descending order. Finally, we selected 50 of the largest businesses from all qualifying businesses as our quality basket. This process resulted in a basket of 50 HQ stocks every year. We tested the performance of the baskets over a period of 10 years, from 2005 to 2014. 4. R isk and returns of the quality basket We now turn to risk and returns of quality businesses. Figure 1 shows the performance of the quality basket on a gross basis [3] as compared to that of MSCI EFM (emerging + frontier markets) Standard index. Because we selected our basket from a universe of all countries excluding developed markets, we consider this index to be the appropriate benchmark. The quality basket generated a compounded annual return of 15.0% as compared to 8.4% for MSCI EFM Standard index. What is more, annualized standard deviations of monthly returns were lower for the quality basket at 14.2% as compared to 23.4% for the benchmark index. Figure 1 (click to enlarge) Figure 2 shows drawdown [4] profiles of the quality basket and of the benchmark index. Clearly, the quality basket is significantly less risky when compared to MSCI EFM Standard index, as drawdowns aren’t only shallower; recovery to peak is quicker as well. In fact, the MSCI EFM Standard index has been underwater since 2007. We estimate the quality basket’s relative risk to be 50% [5] of that of the benchmark index. (click to enlarge) Summary The defining trait of HQ business is the existence of sustainable competitive advantage. Multi-Act’s definition of quality includes quantitative as well as qualitative variables and sustainability of competitive advantage is a key factor. A simple three-factor quantitative process for selecting emerging-market HQ stocks outperforms the publicly traded benchmarks and does so with lower risk. [1] The following industries were excluded for the purposes of this paper: Aluminum, Steel, Pharmaceuticals: Generic, Pharmaceuticals: Major, Pharmaceuticals: Other, Financial Conglomerates, Investment Banks/Brokers, Life/Health Insurance, Major Banks, Multi-Line Insurance, Property/Casualty Insurance, Real Estate Investment Trusts, Regional Banks, Specialty Insurance, Biotechnology, Apparel/Footwear Retail, Major Telecommunications, Electronics/Appliance Stores, and Specialty Stores. [2] Excluding dividends. [3] We include all countries that are not a part of the MSCI World Developed Index. Countries included in MSCI World Developed Index are Australia, Austria, Belgium, Canada, Denmark, Finland, France, Germany, Hong Kong, Ireland, Israel, Italy, Japan, Netherlands, New Zealand, Norway, Portugal, Singapore, Spain, Sweden, Switzerland, United Kingdom, and United States. [4] The peak-to-trough decline during a specific record period of an investment, fund or commodity. A drawdown is usually quoted as the percentage between the peak and the trough. (Source: Investopedia) [5] The worst drawdown of the quality basket is 38% while that of the benchmark index is 61%. The relative risk is estimated as log(1-38%)/log(1-61%) = 50%. At 50% of the benchmark’s risk, relative risk of the quality basket is half that of the benchmark index. This means that it takes about two back-to-back losses of 38% to produce one 61% loss. For more on this, refer to here . References Ramraika, Baijnath, Long-Term Sources of Investment Returns and a Simple Way to Enhance Equity Returns (October 29, 2014). Available at SSRN . Ramraika, Baijnath and Trivedi, Prashant, Investment Returns to Quality in Developed Markets (October 30, 2014). Available at SSRN . Chan, K., Chan, L.K.C., Jegadeesh, N., Lakonishok, J., (2006), “Earnings quality and stock returns,” Journal of Business George, Thomas J., and C.Y. Hwang (2010), “A Resolution of the Distress Risk and Leverage Puzzles in the Cross Section of Stock Returns,” Journal of Financial Economics Novy-Marx, Robert (2013), “The Other Side of Value: The Gross Profitability Premium,” Journal of Financial Economics