Tag Archives: pro

You Can Afford To Hold Cash

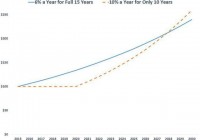
In my last post, I said stocks were too expensive. Instead of putting more of your money into diversified groups of stocks, you should just let cash build up in your brokerage account. A lot of people have a fear that those lost years of making zero percent on their idle cash can never be made up for. I’ve created a graph to show how much ground you’d have to make up. (click to enlarge) Let’s say you have two choices. One is to invest in an overpriced basket of stocks today and hold that basket from 2015 through 2030. This choice will compound your 2015 money at a rate of 6% a year. The second choice is to do nothing for all of 2015, 2016, 2017, 2018, and 2019. You just hold cash. That cash earns 0% for those 5 years. In 2020, you finally get an opportunity to make an investment that will return 10% a year from 2020 through 2030. If your investment horizon extends all the way out from today through 2030, the second approach overtakes the first approach about 15 years from now. Doing nothing for 5 years and then something smart for 10 years is a better 15-plus year strategy than “just doing anything” today. Here, we define something smart as 10% a year and “just doing anything” as 6% a year. You can decide for yourself whether your something smart is 10% a year or not. That’s subjective. What the “doing anything” returns is a lot more objective. So, let’s talk about that. Over the last 15 years, the S&P 500 (NYSEARCA: SPY ) returned about 5% a year. During that time period, the Shiller P/E ratio contracted from 43 to 27. The same percentage contraction – 37% – would be required to get the Shiller P/E down from today’s 27 to a historically “normal” 17. I see no reason why the S&P 500 should do better from 2015 to 2030 than it did from 2000 to 2015. That means I see no reason why buying the S&P 500 today and holding it through 2030 should be expected to return more than about 5% a year. (Almost all readers I talk to have a total return expectation for the S&P 500 that is greater than 5%, even for periods shorter than 15 years.) It’s also worth mentioning that while I have no predictions as to when idle cash would earn more than zero percent, the Fed does. And those predictions show cash earning a few percent in 2018 and 2019, instead of zero percent. For those reasons, the graph in this post is probably an underestimation of how quickly sitting and doing nothing till you can do something smart outperforms continuing to shovel cash into the S&P 500 at today’s prices. I think the reason people don’t feel secure in waiting for an opportunity to do something smart is that they’re not sure when that opportunity will appear. Maybe there will be no chance in all of 2015, 2016, 2017, 2018, 2019, 2020, or even 2021 to do something smart. If that’s true, isn’t it possible doing anything now could outperform waiting to do something smart later? If that later is sometime after 2021, couldn’t it be better to just buy the index today? Yes. I can only point to history. Pick any year in the past. Then move forward 6 years from that time. In the intervening years, was there an opportunity to do something smart? The hardest waiting period in history was during much of 1995 through 2007. Although stocks were often cheaper than they are today, the largest and best-known American stocks were almost always more expensive than they had been at any time before 1995. I think this is the real reason why investors I talk to are hesitant to hold cash. Much of their investing lifetime was spent during a time of high stock prices. There is no advantage in buying something that is unlikely to provide a good long-term return instead of holding cash till something good comes along. If we take 15 years as long term, we can say that the S&P 500 will not provide good long-term returns if bought today. You can afford to avoid 5%-a-year type long-term commitments if you have a real chance at finding 10%-a-year type long-term commitments sometime in the next 5 years. You don’t need to know exactly when or where this opportunity will come. A lot of investors who live outside the U.S. read this blog. They have an advantage. Their home countries’ stock markets might provide a 10%-a-year opportunity sometime in the next 5 years. American investors probably won’t notice such an opportunity when it appears. By buying into an index today, you are really saying you will just take whatever price Mr. Market gives you. You do this because you’re not sure he will ever give you a good price again. Or, if he does, it may come far more than 5 years in the future. Caving into Mr. Market’s mood is not something value investors think is appropriate when it comes to individual stock purchases. Yet, a lot of the people who read this blog – who are otherwise value investors – feel they have no choice but to continuously add to the actively and passively managed mutual funds in their brokerage account. The other choice is to hold cash. And the longer “long term” is for you, the more sense holding cash makes. It makes a lot of sense right now.

Evaluating Managers During Market Extremes

Summary Investing is a probability-based exercise; therefore, having a good decision making process is vitally important. Emotions and investing do not play well together and often lead to poor decisions. Investors should ultimately evaluate investments/managers in a way that minimizes emotional corrosion. Capital markets have a rhythm over the long term. They ebb and flow, creating investor sentiment that fluctuates between euphoria and despair. This pattern is one of the key impediments to becoming a successful investor. In order to succeed, one must master not only investment knowledge, but also investor psychology. Deciphering and filtering large amounts of data in order to make a successful investment is not enough. Investors must also control their emotions which often lead them to poor decisions. Looking at the stock markets today, the S&P 500 and the MSCI All Country World (“ACWI”) continue to climb in spite of lukewarm economic data. Through May 31st, the S&P 500 and ACWI are up 3.2% and 5.4%, respectively. This is quite a return when considering the U.S. Gross Domestic Product was reported down 0.2% for the first quarter. The three-year returns for the S&P 500 and ACWI were also very robust as these markets gained 68.0% and 53.9%, respectively. This pattern has been in place since the bottom of the market was established in early 2009. While the stock market recovery has allowed investors to regain losses from the financial crisis, the euphoria caused by accelerating markets can create doubt in one’s investment philosophy. This can overwhelm an investor’s ability to achieve their investment objectives because it can cause them to “chase returns” or “reach for yield” at the exact time in which they should be exhibiting discipline in their investment philosophy/process. At Highland, our overarching investment philosophy is one rooted in risk management. We believe investors should prudently seek return in a manner which protects them during difficult markets (i.e. large market declines). This philosophy leads us to managers which exhibit certain characteristics: Downside protection: losing less than the overall market during large, protracted declines; emphasis on intrinsic value: the price of an investment does matter; lower long-term volatility: a more consistent return pattern than the overall market (i.e. shorter peaks and troughs); and long-term time horizon: longer holding periods allows for an investment thesis to properly play out. By investing in managers which exhibit these characteristics, we believe that our investors can outperform the overall market over longer periods of time. However, in order to properly execute this philosophy, an investor must remain focused on the long term and remain patient. The goal of this approach is to enhance one’s ability to stick with their investment strategies during very difficult markets. Ironically, this investment approach tends to be most difficult to stomach during periods of rapidly appreciating markets as it and these types of managers will tend to underperform. For this reason, we will focus on evaluating managers during euphoric markets and how to determine if your objectives are still being met. Traditional Evaluation Methodology The most commonly used method to evaluate managers is to simply compare their historical performance to that of a benchmark index. While many different methods can be used, the most common method is annualized time-weighted returns. Figure 1 illustrates time-weighted returns of a global equity manager utilized by Highland: Figure 1 (click to enlarge) In order to evaluate the success of a manager, an investor must first define/understand what they mean by success. Many investors simply define success as a manager outperforming their respective benchmark. Using this measure of success, it appears that the global manager has been struggling to achieve success over the past three and five years. Based upon this analysis, an investor might be tempted to terminate the manager in search of a manager that has provided above-benchmark returns. At Highland, we believe that success is defined by an investor’s ability to achieve their long-term investment objectives. Ultimately, it is not only the return, but also how you achieve the return that determines success. We believe success is determined by the following: Outperforming the benchmark over the long term (minimum of 5-year rolling periods). Protecting capital during difficult markets. Exhibiting an overall volatility lower than the benchmark. The traditional type of analysis ultimately fails to determine success for two reasons. First, only one aspect of success (return) is being examined. Second, it can lead to poor decisions. Figure 2 compares Manager A’s and Manager B’s time-weighted returns. This chart illustrates the value added/subtracted (manager return minus benchmark return) over several time periods. Which manager would you choose? Most would pick Manager B because the value add is much higher and consistent than Manager A. The problem is that A and B are the same manager (see Figure 1 ). The only difference is that A represents data through May 31st and B represents data through February 28, 2009. This illustrates one of the major flaws with utilizing only time-weighted returns in your analysis, which is endpoint sensitivity . Figure 2 (click to enlarge) Endpoint sensitivity is a phenomenon which occurs when the conclusions of an analysis can be significantly altered by changing the ending data point (the ending date in this example). Highland’s investment philosophy employs strategies which seek to protect capital during difficult equity markets. This means that the managers in the portfolio tend to have less downside risk and lower overall volatility. Conversely, they tend to perform less well, on a relative basis, in big up markets. Therefore, this type of strategy often suffers severe endpoint sensitivity during market extremes, which was illustrated in Figure 2 . Highland’s Evaluation Methodology In order to minimize potentially erroneous conclusions caused by endpoint sensitivity, Highland employs additional analyses to evaluate manager success. The first is to consider rolling periods of compound returns (i.e. how consistent are a manager’s returns over longer periods of time). This type of analysis examines the entirety of a manager’s return stream to determine their probability of success. In addition, we examine a manager’s rolling excess performance over the benchmark to ensure consistency. By combining these two methods, we believe that we have a more predictable method of assessing whether a manager has the ability to add value. Figure 3 illustrates the global manager’s results based on this methodology. The results show that the manager has the ability to consistently outperform the benchmark, especially when examining longer time horizons (i.e. outperforming 100% of ten-year periods). This also shows how the results in Figure 1 are more driven by the extreme market environment and less by the manager’s ability to outperform. Figure 3 (click to enlarge) While the results in Figure 3 better account for endpoint sensitivity, they still only capture one aspect of success (return). To evaluate the risk aspect, Highland examines volatility and risk-adjusted returns to ensure a manager is providing the return profile required by our investment philosophy. There are numerous methods that can be used to evaluate risk-adjusted returns, and Highland uses most of them to analyze success. Figure 4 is one example, which examines return per unit of volatility over rolling periods (to eliminate endpoint sensitivity). Figure 4 (click to enlarge) Each of the methods used to evaluate success have their own set of pros and cons; therefore, one method cannot be used in isolation to properly judge a manager. Instead, Highland utilizes all of the methods discussed in order to determine if objectives are being met. This allows us to temper our emotions at market extremes and maintain sound judgment when it is the most difficult. We are then able to focus on the long term and put our clients in a position to achieve their investment objectives. Conclusion Conservative investment strategies can be beneficial for investors. They allow investors to stay calm and stick to their investment philosophy when markets are experiencing large corrections, which place an investor in the position to achieve their investment objectives over the long term. On the other hand, these types of strategies struggle to keep up with markets during long, protracted upswings, which could cause an investor to question the validity of a conservative strategy. It is important to understand that traditional evaluation tools at market extremes (i.e. peaks and troughs) often skew the appearance of success or failure. For this reason, Highland utilizes evaluation metrics that limit endpoint sensitivity. Therefore, investors can limit their emotions and make decisions in a manner that is prudent and most beneficial for their portfolio. Disclosure: I/we have no positions in any stocks mentioned, and no plans to initiate any positions within the next 72 hours. (More…) I wrote this article myself, and it expresses my own opinions. I am not receiving compensation for it. I have no business relationship with any company whose stock is mentioned in this article.

How To Select Securities

In earlier steps, you should have defined top level asset classes that have a lack of correlation to one another and a timeless strategy. Then, you should have selected underlying sectors that strategically boost returns and take advantage of leading indicators. Lastly, you determined a system to categorize future holdings to implement your investment strategy . The next step is to select specific securities you will purchase to implement this strategy. We call this list of securities our “Buy List,” because it is what we would ideally purchase if a client came to us all in cash. We regularly review our Buy List as we are always looking for even better securities to implement our investment strategy. We use three criteria to judge securities. First, the investment should be diversified within its sector. Diversification is the means of achieving a rebalancing bonus , a boost in returns and decrease in volatility due to moving between low correlation stocks. This bonus is highest when the correlation is lowest, but even correlated assets which often move in sync over the long run experience different volatility and returns over any given year. For this reason, your Buy List investment selections should be as diversified as possible within the targeted sector. Such diversification is not easily achieved with individual company stocks. To use U.S. large cap stocks as an example, you would need over 60 individual stocks to achieve only 86% of the diversification . Diversification via individual stocks is even more difficult for small and mid-cap stocks and impossible to accomplish for foreign stock categories using US stock exchanges. For this reason, your buy list should be funds – exchange traded funds (ETFs) or mutual funds – rather than individual securities. There are two methods of seeing how well diversified a fund is within its category. First, favor funds with a large number of holdings. There is no such thing as “over-diversification.” A fund with 200 small cap value stocks is better diversified than one with only 75. Second, favor funds where the top ten holdings represent a smaller percentage of the fund. A small cap value fund whose top ten holdings represent 75% of the fund is less diversified than one where the top ten holdings only represents 25% of the fund. Second, the expense ratio should be low. The most important selection criterion is expense ratio. Morningstar did a study to see what was a better indicator of a fund having better returns in the future: having a low expense ratio or having more Morningstar stars. They determined that having a low expense ratio was a better indicator than Morningstar stars . Low expense ratios help you earn more when markets go up and lose less when they go down. Over time, this can significantly affect the value of your portfolio. The return of an index fund is simply the return of the index plus or minus tracking error minus fund expenses. This is why having a low expense ratio gives you the best chance of having higher returns. Currently the average asset weighted expense ratio for a stock mutual fund is 0.74%. This cost has been dropping over the past decade as funds have to lower costs in order to compete for market share. In most cases, a good investment advisor can significantly reduce the cost of the funds used to diversify your portfolio. We regularly build portfolios with low expense ratios, and many of the revisions we make to our Buy List are moving towards lower cost funds. Our online gone fishing portfolio has an expense ratio of just 0.32% . Finally, we look for low trading costs. Trading costs, like expense ratios, can hurt returns. While expense ratios hurt fund returns, trading costs hurt the rebalancing bonus by putting a drag on moving in and out of investments. Trading costs are tied to your custodian. For this reason, selection of your custodian is extremely important to your investment philosophy. At Schwab, there are four different types of investments, each with their own type of trading cost. Most stock and ETF trades are made at Schwab’s $8.95 per trade brokerage fee. There are some ETFs on the Schwab platform for which they wave the brokerage fee and allow you to trade them for no cost. This can be deceptive. Some of the no-transaction fee ETFs are Schwab funds with higher expense ratios or larger trading spreads either of which could be more costly than a trading fee. For mutual funds, there is a fee between $25 and $50 depending on how much is being traded and how you have negotiated fees for your clients. Although you should hunt for low trading costs, you should also change your purchasing habits based upon the cost. First, because of compound interest, larger amounts of money can overcome a small trading cost faster than smaller amounts of money. So, if you have a trading cost, assess the how long different initial investments takes to earn back the fee. We do this by measuring the trading cost as a percentage of the purchase amount. If you are purchasing $30,000 of an investment, a $30 trading fee is only 0.1%, which could be earned back in a week. However, if you are only investing $600 in the same investment, the same trading fee would be 5% of your investment, which may take 1 year to earn back. Second, we use a simple technique we call “Rocks and Sand” to keep total expenses low without losing the flexibility of diversifying and rebalancing. Rocks are higher trading cost but lower expense ratio investments. They have a fee when you purchase them as well as a fee when you break them apart but they are cheaper to hold once you have purchased them because of their lower expense ratio. Meanwhile, sand has a lower trading cost but a higher expense ratio. Sand is easy to move from one investment to another but is not ideal for long-term holding. Our transaction fee ETFs or mutual funds are Rocks while no-transaction-fee funds are Sand. We fill each asset class with Rocks. Then when smaller monthly deposits come in, we fill in the asset class with Sand around the Rocks. When a significant amount of Sand collects in an asset class, we sell the sand to purchase a Rock in its place. In this manner, you can identify ideal securities for your Buy List as well as trade them efficiently. Although it is not easily appraised, we believe a curated list of funds is extremely valuable. Our investment committee meets regularly to reevaluate and adjust our Buy List. Even if all you use to select funds is expense ratio, the value might be as high as 0.42%. We can only imagine the value of fund selection also based on strategic fit, diversification, index followed, and trading costs. Your investment strategy is critically important but the implementation requires wise fund selection.