Tag Archives: pro

PureFunds Cyber Security ETF: Troubling Inconsistencies And Specific-Holding Concerns Should Make Investors Think Twice

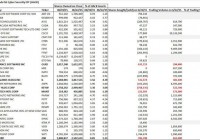
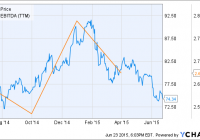
Summary Due to increased investor interest in the cyber security space, the PureFunds Cyber Security ETF has grown rapidly since its launch in November 2014, with assets now exceeding $1.2B. Its track record has been impressive, returning nearly 22% since inception. Our tracking of the recent semi-annual reconstitution, however, raises some troubling questions about the validity of the data that this ETF is reporting. Specifically, reported changes in positions on reconstitution that occurred this past Monday, in several instances, seem to be impossible to have been executed based on that day’s trading volume data. Finally, we are concerned about the high level of ownership the ETF now has in several small cap names, and would caution investors regarding risks in owning these names. Background The PureFunds Cyber Security ETF (NYSEARCA: HACK ) was launched in November 2014 to track the ISE Cyber Security Index, and seeks to provide investors with exposure to the hot cyber security technology sector. The index (and ETF) provide exposure to large, well-known cyber security plays, such as Palo Alto Networks (NYSE: PANW ) and FireEye (NASDAQ: FEYE ), in addition to other large cap technology companies such as Cisco (NASDAQ: CSCO ) and Juniper Networks (NYSE: JNPR ) that, while not pure plays, are deemed to be relevant to cyber security. At a high level, the index owns companies that fall into either the cyber security infrastructure, or cyber security services sub-categories, with the infrastructure group making up the overwhelming majority of the index. One of the lesser understood features of the index, however, is that it seeks to equal weight its components within the infrastructure and services sub-categories. A complete explanation of the index’s construction methodology can be found here . This unique index construction means that small-cap (and even micro-cap) stocks are weighted similarly in many cases to large-cap stocks. Herein lies some issues that we recently came across when analyzing this past Monday’s index/ETF reconstitution. Recent Index/ETF Reconstitution According to ISE index methodology and the HACK ETF methodology , components are re-weighted twice annually, on market close on the third Friday in December and June (and become effective the following Monday), the most recent reconstitution of ISE Cyber Security index having occured on this past Friday’s market close, June 19. The index weighting changes were announced after the close on that date. The HACK ETF, in order to track the underlying index, must then adjust their holdings, i.e. buy/sell the individual stocks held, in this most recent case on Monday, June 22 to realign themselves with the index. PureFunds posts its daily holdings in HACK as of the close each day, along with the ETF’s underlying Net Asset Value (or NAV), total assets, etc. Thus holdings can be tracked on a daily basis. As expected, there were large changes in the end of day holdings reported in HACK between Friday, June 19 and Monday, June 22, with the changes being inline with the newly announced stock weightings of the underlying ISE index. Below we show the reported holdings as of each close on these two dates in HACK, as obtained directly from their site (linked above) along with analysis of shares bought/sold on June 22 (note that we only did the analysis for US-listed stocks): (click to enlarge) (Source: PureFunds site for daily share ownership, Yahoo for June 22 trading volume) As can be seen from the data above, there are several stocks for which the supposed buy/sell volume from HACK exceeded 100% of the June 22 total trading volume in that stock. We have highlighted in bold in the table above the stocks we are referring to. Clearly, this raises some troubling questions as clearly HACK could not have traded more than 100% of the day’s total volume: Is HACK accurately reporting their end of day holdings in the ETF? Is the end of day reported NAV therefore accurate? If these shares were in fact traded on either 1) different days than June 22, 2) across multiple trading days, or 3) yet to be fully traded, then why were the end of day share holdings reported as the above by PureFunds? We do not profess to know the answers to these questions, despite our attempts to understand their trading/reporting methodology through reading their prospectus linked above. We, nonetheless, find the inconsistency of their reported data to be troubling and thus would be cautious in relying on both claimed share holdings AND reported NAV, which investors in HACK rely on to assess the fair market value of the ETF. Note that we have contacted PureFunds, sent them this data, and asked for an explanation, but have received no response . If we do get a response from them, we will certainly share it with our readers. Ownership concentration in small cap names As noted above, the HACK ETF (and underlying index) have an unusual equal-weighting (rather than market cap weighting) structure that causes the ETF to have outsized ownership of certain small cap names. The two that we’d highlight specifically, for which the ETF has the highest percentage ownership of shares outstanding are below: Company Ticker HACK shares owned 6/23 S/O from latest 10-Q HACK % ownership Widepoint Corp WYY 7,532,622 82,135,803 9.2% KEYW Holding Corp KEYW 3,463,191 38,222,484 9.1% We highlight Widepoint (NYSEMKT: WYY ) and KEYW Holding (NASDAQ: KEYW ) specifically because they are the two stocks that HACK has the highest percentage ownership (both now approaching 10%), though there are other small-cap names for which HACK ownership is now 5.0% or greater, namely Intralinks (NYSE: IL ), Guidance Software (NASDAQ: GUID ), and Zix Corp (NASDAQ: ZIXI ). We specifically are concerned about these stocks because 1) they have all seen significant share price increases recently, we believe, driven primarily by fund flows into HACK, which disproportionately are allocated into these small cap names per the index methodology, 2) we question whether, even if HACK fund inflows remain robust, the ETF will be comfortable owning 10% or more of any individual stock (which would then require filings with the SEC as a ‘beneficial owner’ in the stock and Form 4 reporting within 2 business days of any buy/sell transaction, and perhaps, most importantly, potentially make the ETF subject to “Short-Swing” liabilities). For those not familiar with beneficial ownership reporting requirements, Short-Swing rules, etc, here is a useful summary presentation . We severely doubt that the HACK ETF would wish to exceed 10% ownership in any of these names. Therefore, we believe the recent appreciation in the names, driven primarily by HACK ETF buying, is likely nearing an end, thus leaving a sudden dearth of buying to support these names and making them very susceptible to pullbacks in the absence of the somewhat artificial buying from HACK. Conclusion We are troubled by the seeming inconsistency of the data reported by HACK and thus question both the accuracy of its reported share holdings on a day-to-day basis, and the reported NAV. We would thus avoid owning HACK as a means for gaining exposure to cyber security. Alternatively, we would suggest that an investor instead own individual cyber security stocks which they know and are comfortable with (we are long PANW, and have been for some time, as an example). We would also highly caution against owning and even encourage selling the small cap names which we highlighted above, that we believe have been temporarily, and somewhat artificially, bid up by the HACK ETF. We believe all could be subject to (potentially substantial) pullbacks before too long. We would be especially cautious in WYY and KEYW, where HACK ownership is already nearing the key 10% threshold. Disclosure: I am/we are long PANW. (More…) I wrote this article myself, and it expresses my own opinions. I am not receiving compensation for it (other than from Seeking Alpha). I have no business relationship with any company whose stock is mentioned in this article. Additional disclosure: We may initiate long or short positions in any of the named securities at any point.

DTE Energy: Bearish Sentiment And Solid Earnings Potential Make This Utility Look Undervalued

Summary Electric and natural gas utility DTE Energy’s share price has fallen in recent months despite strong earnings and management guidance. Environmental regulations are requiring the company to incur large expenses as it moves away from coal-fired capacity but it has the cash flow and liquidity to handle these. Furthermore, the economy in its service area is rebounding as Michigan’s unemployment rate has plummeted to the national average from its 2010 highs. Finally, the company is also investing in new capacity and is expanding its non-regulated operations so as to ensure sustained earnings and dividend growth over the next several years. Macroeconomic pressures have pushed the company’s share price close to the level at which they would be clearly undervalued and I would consider buying. The share price of electric and natural gas utility DTE Energy (NYSE: DTE ) has fallen by roughly 20% since the end of January (see figure) as the company has been hit by bearish sentiment on a number of fronts, including an expected rate increase from the Federal Reserve, weather during the first quarter that was warmer than during the same quarter of the previous year, and a combination of state and federal environmental regulations that have placed pressure on utilities to replace coal with natural gas and renewables. At the same time, however, the price decline has coincided with two consecutive quarterly earnings beats, low energy prices, and signs of a rebounding economy in the company’s service area. This article evaluates DTE Energy as a potential investment opportunity in light of this operating environment. DTE data by YCharts DTE Energy at a glance DTE Energy generates and distributes multiple types of energy from various pathways in the state of Michigan. The company was formed by the 2001 merger of the electric utility Detroit Edison Co. and the natural gas utility Michigan Consolidated Co. The two utilities now comprise DTE Energy’s two largest subsidiaries and operating segments under the names DTE Energy Electric Co. (“DTE Electric”) and DTE Gas Co. (“DTE Gas”). DTE Electric serves southeast Michigan, including Detroit and the surrounding area, generating electricity that it transmits to approximately 2.1 million customers. The subsidiary owns and operates 11,084 MW of generating capacity. Of this, approximately 70% is coal-fired, 10% is gas-fired or renewable (primarily hydroelectric with a smaller amount of biomass-fired capacity), and 20% is nuclear, the latter comprising 30% of Michigan’s total nuclear capacity. The heavy reliance of DTE Electric on coal-fired capacity has become a burden in recent years as inexpensive natural gas has made that fuel a more attractive option than coal and regulations at the state and federal levels have discouraged coal’s combustion. The company is investing heavily to replace much of its existing coal capacity with natural gas (in part via the acquisition of new gas-fired facilities) and renewables (such as the conversion of existing coal-fired facilities to biomass). The company expects coal’s total share of generating capacity to fall from 70% to 30% by 2030, offset by an increase to the share of gas and renewables from 10% to 50%. DTE Gas distributes natural gas to 1.2 million customers across Michigan, including the Detroit and Upper Peninsula areas. The subsidiary owns and operates 278 storage wells equal to 34% of Michigan’s underground capacity. It primarily serves the northern Michigan and Upper Peninsula areas and also owns the small Citizens Gas Fuel natural gas utility. While DTE Electric and DTE Gas are responsible for the vast majority of DTE Energy’s consolidated earnings (84% in Q1, split roughly evenly between the two subsidiaries), the company also owns smaller non-utility segments, including a gas storage and pipelines segment and a power & industrial projects segment, which provide most of the rest of the consolidated earnings. Finally, the company also operates an energy trading segment, although its contribution to earnings is generally minimal. Higher energy prices caused DTE Energy’s revenue to soar by 40% from 2012 to $12.3 billion in FY 2014 (see table). Although this was partially offset by similar increases to input and operating costs, its operating income and net income reached post-recession highs last year. While continuous profitability is to be expected from regulated utilities, with regulators commonly setting rates high enough to allow the utilities to achieve returns of equity of around 10%, DTE Energy’s earnings growth has caused its share price to achieve performance not common among utilities, more than tripling between 2009 and 2015. DTE Energy Financials (non-adjusted) Q1 2015 Q4 2014 Q3 2014 Q2 2014 Q1 2014 Revenue ($MM) 2,984.0 3,078.0 2,595.0 2,698.0 3,930.0 Gross income ($MM) 1,586.0 1,749.0 1,476.0 1,422.0 1,775.0 Net income ($MM) 273.0 299.0 156.0 124.0 326.0 Diluted EPS ($) 1.53 1.69 0.88 0.70 1.84 EBITDA ($MM) 715.0 832.0 578.0 564.0 875.0 Source: Morningstar (2015) One reason for DTE Energy’s impressive performance has been its ability to maintain a solid balance sheet in the type of volatile operating conditions that have been present since 2010. The company has maintained a current ratio of around 1.2 over the last five years, regularly ending the fiscal year with roughly $50 million in cash reserves (see table), even as its total assets have increased by $1.5 billion more than its total liabilities. While the company maintains a large amount of long-term debt ($8.3 billion at the end of FY 2014), this is not uncommon for regulated utilities and the firm’s interest expenses have actually declined even as its total debt load has increased. Overall, DTE Energy has been a strong performer in a sector that has done well for itself on average in recent years. DTE Energy Balance Sheet (restated) Q1 2015 Q4 2014 Q3 2014 Q2 2014 Q1 2014 Total cash ($MM) 99.0 48.0 60.0 75.0 98.0 Total assets ($MM) 28,068.0 27,974.0 26,376.0 26,189.0 26,161.0 Current liabilities ($MM) 1,839.0 2,577.0 2,805.0 2,819.0 3,569.0 Total liabilities ($MM) 19,403.0 19,647.0 18,207.0 18,181.0 18,044.0 Source: Morningstar (2015) Q1 earnings report DTE Energy reported its Q1 earnings in late April, beating on the top line and missing on the bottom line. Revenue came in at $3.0 billion, down 24% from $3.9 billion the previous year and missing the analyst consensus by $550 million. The decline was mostly attributable to the presence of much lower energy prices in the most recent year compared to Q1 2014, which caused the company to reduce the prices charged to its customers. DTE Gas reduced its natural gas prices by 17% compared to the previous year while DTE Electric reduced its own rates by 6%. The 24% YoY decline was also due in part to the fact that Q1 2014 was Michigan’s coldest in 60 years, driving sales volumes at DTE Gas. Q1 2015 was still cold (the third coldest in the last 60 years), but warmer than the previous year. DTE Energy’s consolidated operating income fell to $461 million from $560 million the previous year, driven by reduced natural gas demand and the presence of lower prices. Cost of revenue fell 35% YoY, however, mostly offsetting these factors. Furthermore, operating expenses fell by 7% YoY as O&M fell substantially. This latter decline enabled the company to report net income of $273 million compared to $326 million the previous year, or diluted EPS of $1.53 versus $1.84 the previous year. Adjusted diluted EPS was $1.65 compared to $1.69 YoY due to an adjustment of $0.18 attributed to the Energy Trading segment, which beat the analyst consensus by $0.12. The relatively warm weather in Q1 had a pronounced impact on the company’s earnings: while DTE Electric’s EPS was virtually unchanged YoY, that of DTE Gas was $0.11 lower compared to the previous year. Finally, EBITDA came in at $715 million compared to $875 million the previous year. In all, then, it was a strong quarter for the company, with the negative annual comparison being the result of 2014’s historically cold Q1 rather than underperformance at the company itself in Q1 2015. DTE Energy’s balance sheet also remained in good shape at the end of Q1. Operating cash flow for the quarter rose from $532 million the previous year and $541 million the previous quarter to $747 million, allowing the company to repay $117 million in debt and making $240 million worth of acquisitions, all while maintaining its $0.69 quarterly dividend (3.7% yield at the time of writing). The company no longer has any short-term debt on its books, and it ended the quarter with $99 million in cash compared to $98 million at the end of Q1 2014. Outlook DTE Energy’s Q1 results were in-line with its expectations, and its management expects to achieve an adjusted EPS range for FY 2015 of $4.48-$4.72. While not as strong as its FY 2014 EPS, which was boosted by a very impressive weather-induced Q1 result, even the bottom of the range would place FY 2015 as the 2nd-strongest quarter since FY 2009. Investors have a number of reasons to be optimistic regarding the company’s short-term outlook, not least of which is Michigan’s rebound from the 2008 financial crisis and subsequent recession, both of which had a disproportionately painful impact on the state. Michigan’s unemployment rate, which as recently as 2010 was several percentage points higher than the U.S. unemployment rate, has made up ground recently and is now the same as the national average (see figure). While some of the decline in the state’s rate has been to emigration, the state’s economy has finally begun to rebound following Detroit’s bankruptcy. Michigan is not expected to become a major economic growth story in coming years, let alone return to its days as an industrial powerhouse, but the economic recovery will benefit DTE Energy by driving residential demand for electricity and natural gas at the very least, as well as industrial demand under a more optimistic scenario. Michigan Unemployment Rate data by YCharts The fall in electricity rates and natural gas prices that has occurred since August 2014 has also driven demand for both, and this boost could grow still further if natural gas prices remain lower or fall further still. The citygate price of natural gas in Michigan is currently 14% lower than at the same time a year ago (see figure), while residential and industrial consumption of natural gas are both up strongly over the same period. Environmental regulations restricting the use of coal for generating electricity will prevent the company from taking full advantage of this demand since a large percentage of its capital expenditures are aimed at replacing coal capacity rather than acquiring net increases to existing capacity, but it still intends to invest $450 million just in new capacity for DTE Electric in FY 2015. This will be financed by a combination of operating cash flows, the issuance of $850 million in equity by the end of FY 2017, and $1.9 billion in available liquidity that recently had its maturity extended to April 2020. DTE Electric continues to access debt at low interest rates, with management stating during the Q1 earnings call that its most recent 30-year bond issuance achieved the company’s lowest interest rate since the Eisenhower administration. DTE Energy is positioned to successfully invest $11.5 billion in capital expenditures through 2019, $7.5 billion of which will go toward acquiring new capacity and replacing coal with natural gas and renewables. Michigan Natural Gas Citygate Price data by YCharts Finally, DTE Energy is also positioning itself to take advantage of America’s recent status as a major producer of hydrocarbons by transporting energy from inland reserves to its customers in Michigan. The company has formed a partnership with Spectra Energy to build a 250-mile pipeline connecting the Marcellus and Utica shales with a pipeline hub in Michigan that in turn connects Ohio, Chicago, and Ontario. DTE Energy is contributing $700 million to the NEXUS pipeline, which is expected to be in service by Q4 2017. With 1.5 Bcf/day capacity, the pipeline will be an important addition to the region’s existing pipeline infrastructure when completed. There are still many hurdles to overcome, with regulators recently taking issue with the pipeline’s proposed route, but construction isn’t expected to begin for at least another year, at which point it will take only a year to complete. Valuation Not surprisingly, given management’s recent guidance, analyst estimates for DTE Energy’s diluted EPS in FY 2015 and FY 2016 have increased only very slightly over the last 90 days. The FY 2015 consensus has increased from $4.62 to $4.64 while the FY 2016 estimate has increased from $4.91 to $4.92. Based on the company’s share price at the time of writing of $74.34, its shares are trading at a trailing P/E ratio of 16.3x and forward ratios of 16.0 and 15.1, respectively. All of these ratios are in the bottom half of their 3-year historical ranges (see figure), although the forward ratios would need to fall below 14x before the company could be considered to be clearly undervalued. DTE PE Ratio (TTM) data by YCharts Conclusion DTE Energy’s share price has fallen substantially even though it has had a good year to date. Its shares certainly appear to be more attractive based on forward valuations than they were at the beginning of the year, a result that can be largely attributed to the prevalence of bearish sentiment toward dividend stocks in anticipation of one or more interest rate hikes by the Federal Reserve later in the year. With a 3.7% yield, an improved operating environment, and plans to increase regulated capacity while expanding its non-regulated operations, DTE Energy is an attractive long investment candidate. I think that interest rate expectations could push the company’s shares lower in the coming months, but I would consider purchasing its shares in the event that they fall below $69 (or 14x the FY 2016 consensus EPS) in the near future. Disclosure: I/we have no positions in any stocks mentioned, but may initiate a long position in DTE over the next 72 hours. (More…) I wrote this article myself, and it expresses my own opinions. I am not receiving compensation for it (other than from Seeking Alpha). I have no business relationship with any company whose stock is mentioned in this article.

Left Smarting – Smart Beta Products May Not Make Bad Decisions But They Do Facilitate Them

By Kevin Murphy ‘But guns don’t kill people, people do’ is a line less likely to settle an argument than provoke further discussion and yet it is not impossible to imagine an advocate of so-called ‘smart beta’ investments – strategies that try to build on simple index-tracking products by focusing in on a specific factor, such as growth, momentum or value – using a similar refrain. “But smart beta products don’t make bad investment decisions, investors do,” they might tell a doubter. To which we would reply – as we would to anyone trying the gun line – “OK, but they do make the job a lot easier.” We touched on this idea of smart beta products exacerbating investors’ well-documented inability to judge when to buy into and sell out of markets in, among other articles, Smart thinking . That piece was inspired by some fascinating work by our friends at Empirical Research Partners and, since they have recently returned to the subject, we shall too. What Empirical has done is to look at two relationships – first, between past performance and where investors put their money and, second, between where investors put their money and subsequent performance. As you can see from the chart below, for eight out of the 11 categories of smart beta strategies analysed, there is a very strong positive correlation between past performance and future fund flows, with those directing money towards yield-type exchange traded funds (ETFs) apparently the most prone to invest with at least one eye on the rear view mirror. Source: Strategic Insight Simfund, Empirical Research Partners Analysis, June 2015 Here on The Value Perspective, we have no major philosophical issue with investors putting money into areas that have performed well, if – and it is a big if – they continue to perform well. So did Empirical identify any sort of positive relationship between performance in consecutive quarters? Did funds that performed well continue to do so? The answer, as you can see from the following chart, is ‘not really’. Source: Strategic Insight Simfund, Empirical Research Partners Analysis, June 2015 Indeed, returns to yield ETFs are so mean-reverting that, as Empirical observes: “If anything, investors should be buying them after down-quarters rather than up-quarters.” As value investors, we also cannot resist pointing out how momentum ETFs have a negative correlation here too – after all, the one quality investors might think they could count on from such a strategy would be, well, momentum. One final aspect of Empirical’s research we would highlight is the finding that, on average, smart beta strategies turn over about a third of their total capitalisation every month. This would of course imply the average holding period for a smart beta investor is three months – in other words, the average holding period mirrors the time frames of fund flows and performance discussed above. The picture being painted here is of a dispiriting and, to our minds, frankly nonsensical investment routine, where your average smart beta investor sees good performance, buys it, sells up after a quarter of likely disappointing performance, buys something else that has performed well, sells up after a quarter of likely disappointing performance and on and on until, presumably, they have no money left. No doubt, the groups that run smart beta strategies would argue they are intended to allow investors to tilt their exposure to factors they believe will deliver strong performance over the longer term. The reality seems to be, however, that that is not how many people use them – choosing instead to churn smart beta ETFs in the hope of squeezing the best possible performance from quarter to quarter. As we never tire of pointing out here on The Value Perspective, nothing in life is certain but, if anything came close, it would be that such a hope is destined to end in disappointment. Ultimately, one of the supposed selling points of smart beta ETFs – the ease with which investors can pick out and trade a particular strategy – is working against them. Instead of tangible companies, complete with management teams, business models and financial statements, ETF investors are buying into ethereal concepts that are based on other people’s definitions of value or momentum, say – and, if one does not work, it is significantly easier to give up and buy an alternative. That of course is the antithesis of what value investors look to do, preferring instead to play the patient, long-term game, with an average holding period of three or five years.