Tag Archives: pro

SPDR S&P MidCap 400 ETF: MDY’s 2014 And Fourth-Quarter Performance And Seasonality

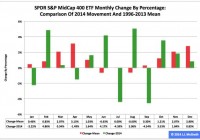
Summary The SPDR S&P MidCap 400 ETF ranked No. 2 in 2014 among the three most popular exchange traded funds based on the S&P 1500’s constituent indexes. Most recently, the ETF’s adjusted closing daily share price last month expanded to $263.97 from $261.79, an increase of $2.18, or 0.83 percent. Seasonality analysis shows the fund’s price accelerates in the fourth quarter of an average year, but decelerated in Q4 of last year. The SPDR S&P MidCap 400 Trust ETF (NYSEARCA: MDY ) ranked second by return during 2014 among the three most popular ETFs based on the S&P 1500’s constituent indexes, as it behaved worse than the SPDR S&P 500 Trust ETF (NYSEARCA: SPY ) and better than the iShares Core S&P Small-Cap ETF (NYSEARCA: IJR ). Measured by adjusted closing daily share prices, MDY climbed to $263.97 from $241.29, a hike of $22.68, or 9.40 percent. Accordingly, the middle-capitalization ETF underperformed the large-cap SPY by -4.06 percentage points and overperformed the small-cap IJR by 3.55 percentage points. Both seasonality and U.S Federal Reserve policy appear likely to be headwinds for MDY over the coming quarter. The Fed announced the end of asset purchases under its third formal quantitative easing program on October 29, 2014, and may announce the beginning of its next round of federal funds rate increases on April 29, 2015. The Fed’s conclusion of purchases under its first two formal QE programs this century is associated with bear markets in MDY , with the ETF slipping -21.16 percent in 2010 and -28.13 percent in 2011. Figure 1: MDY Monthly Change, 2014 Vs. 1996-2013 Mean (click to enlarge) Source: This J.J.’s Risky Business chart is based on analyses of adjusted closing monthly share prices at Yahoo Finance . MDY behaved a little worse in 2014 than it did during its initial 18 full years of existence, based on the monthly means calculated by employing data associated with that historical time frame (Figure 1). The same data set shows the average year’s weakest quarter was the third, with a relatively small negative return, and its strongest quarter was the fourth, with an absolutely large positive return. The ETF ran true to form overall in Q4 last year, but its share price decelerated rather than accelerated into 2015. Figure 2: MDY Monthly Change, 2014 Vs. 1996-2013 Median (click to enlarge) Source: This J.J.’s Risky Business chart is based on analyses of adjusted closing monthly share prices at Yahoo Finance. MDY performed much worse in 2014 than it did over its initial 18 full years of existence, based on the monthly medians calculated by using data associated with that historical time frame (Figure 2). The same data set shows the average year’s weakest quarter was the third, with a relatively small negative return, and its strongest quarter was the fourth, with an absolutely large positive return. Meanwhile, the latest figure generated by my proprietary U.S. Economic Index methodology and other multivariate analyses continue to indicate the metric may have hit either a long- or a short-term high level in August. As a result, I suspect American economic performance could soon join seasonality and Fed policy as a headwind for the equity market in general and for MDY in particular. Disclaimer: The opinions expressed herein by the author do not constitute an investment recommendation, and they are unsuitable for employment in the making of investment decisions. The opinions expressed herein address only certain aspects of potential investment in any securities and cannot substitute for comprehensive investment analysis. The opinions expressed herein are based on an incomplete set of information, illustrative in nature, and limited in scope. In addition, the opinions expressed herein reflect the author’s best judgment as of the date of publication, and they are subject to change without notice.

SPDR S&P 500 ETF: SPY’s 2014 And Fourth-Quarter Performance And Seasonality

Summary The SPDR S&P 500 ETF ranked No. 1 in 2014 among the three most popular exchange-traded funds based on the S&P 1500’s constituent indexes. Most recently, the ETF’s adjusted closing daily share price last month declined to $205.54 from $206.06, a loss of -$0.52, or -0.25 percent. The last time the ETF had a negative return in the seasonally strong month of December was 2007. The SPDR S&P 500 ETF (NYSEARCA: SPY ) ranked first by return during 2014 among the three most popular ETFs based on the S&P 1500’s constituent indexes, which also encompass the SPDR S&P MidCap 400 ETF (NYSEARCA: MDY ) and the iShares Core S&P Small-Cap ETF (NYSEARCA: IJR ). SPY advanced to $205.54 from $181.15, a gain of $24.39, or 13.46 percent, in terms of adjusted closing daily share prices. Neither seasonality nor U.S Federal Reserve policy appears likely to be supportive of SPY at its current elevated level over the coming quarter. The Federal Open Market Committee announced the end of asset purchases under its third formal quantitative-easing program Oct. 29 and may announce the beginning of its next round of federal-funds-rate increases April 29. Figure 1: SPY Monthly Change, 2014 Vs. 1994-2013 Mean (click to enlarge) Source: This J.J.’s Risky Business chart is based on analyses of adjusted closing monthly share prices at Yahoo Finance . SPY behaved better in 2014 than it did over its initial 20 full years of existence based on the monthly means calculated by employing data associated with that historical time frame (Figure 1). The same data set shows the average year’s strongest quarter was the fourth, with an absolutely large positive return, and its weakest quarter was the third, with an absolutely small positive return. The last time the ETF had a negative return in the seasonally strong month of December was 2007. Figure 2: SPY Monthly Change, 2014 Vs. 1994-2013 Median (click to enlarge) Source: This J.J.’s Risky Business chart is based on analyses of adjusted closing monthly share prices at Yahoo Finance. SPY behaved worse in 2014 than it did over its initial 20 full years of existence based on the monthly medians calculated by using data associated with that historical time frame (Figure 2). The same data set shows the average year’s strongest quarter was the fourth, with an absolutely large positive return, and its weakest quarter was the third, with a relatively small positive return. Last year, the ETF performed best in the second quarter and worst in the third quarter. Disclaimer: The opinions expressed herein by the author do not constitute an investment recommendation, and they are unsuitable for employment in the making of investment decisions. The opinions expressed herein address only certain aspects of potential investment in any securities and cannot substitute for comprehensive investment analysis. The opinions expressed herein are based on an incomplete set of information, illustrative in nature, and limited in scope. In addition, the opinions expressed herein reflect the author’s best judgment as of the date of publication, and they are subject to change without notice. Now that you’ve read this, are you Bullish or Bearish on ? Bullish Bearish Sentiment on ( ) Thanks for sharing your thoughts. Why are you ? Submit & View Results Skip to results » Share this article with a colleague

How Strong Is SCHV? I’m Considering It As A Core Holding.

Summary I’m taking a look at SCHV as a candidate for inclusion in my ETF portfolio. The risk level is great, though the high correlation to SPY shouldn’t be a surprise. The ETF has fairly decent yields and a great composition of companies. I’m not assessing any tax impacts. Investors should check their own situation for tax exposure. Investors should be seeking to improve their risk adjusted returns. I’m a big fan of using ETFs to achieve the risk adjusted returns relative to the portfolios that a normal investor can generate for themselves after trading costs. I’m working on building a new portfolio and I’m going to be analyzing several of the ETFs that I am considering for my personal portfolio. One of the funds that I’m considering is the Schwab U.S. Large-Cap Value ETF (NYSEARCA: SCHV ). I’ll be performing a substantial portion of my analysis along the lines of modern portfolio theory, so my goal is to find ways to minimize costs while achieving diversification to reduce my risk level What does SCHV do? SCHV attempts to track the total return of the Dow Jones U.S. Large-Cap Value Total Stock Market Index. At least 90% of funds are invested in companies that are part of the index. SCHV falls under the category of “Large Value”. Does SCHV provide diversification benefits to a portfolio? Each investor may hold a different portfolio, but I use (NYSEARCA: SPY ) as the basis for my analysis. I believe SPY, or another large cap U.S. fund with similar properties, represents the reasonable first step for many investors designing an ETF portfolio. Therefore, I start my diversification analysis by seeing how it works with SPY. I start with an ANOVA table: (click to enlarge) The correlation is about 98%. That’s simply too high to provide a very meaningful diversification benefit. I measure risk with the standard deviation of daily returns. It isn’t perfect, but it works fairly well for my purposes and seems to hold up over time. Because the correlation is very high, the standard deviation of returns will be a fairly significant factor. Standard deviation of daily returns (dividend adjusted, measured since January 2012) The standard deviation is great. For SCHV it is 0.7027%. For SPY, it is 0.7300% for the same period. Since SPY usually beats other ETFs in this regard, I’d look at that standard deviation level as being fairly favorable. Of course, since SPY and SCHV hold several of the same companies a high correlation was pretty much a given. Since the Value side of the index should have more stability and less risk, the findings are in line with my expectations. Mixing it with SPY I also run comparisons on the standard deviation of daily returns for the portfolio assuming that the portfolio is combined with the S&P 500. For research, I assume daily rebalancing because it dramatically simplifies the math. With a 50/50 weighting in a portfolio holding only SPY and SCHV, the standard deviation of daily returns across the entire portfolio is 0.7128%. The value side of the index (which SCHV is tracking) has been outperformed by the growth side of the portfolio. I would expect that to usually happen during a bull market. When a bear market occurs, I would expect the value side to hold up a little better. Since I believe in being fairly defensive about protecting capital, the value side is more appealing to me. Why I use standard deviation of daily returns I don’t believe historical returns have predictive power for future returns, but I do believe historical values for standard deviations of returns relative to other ETFs have some predictive power on future risks and correlations. Yield & Taxes The distribution yield is 2.33%. The SEC 30 day yield is 2.52%. I’m pretty comfortable with this ETF as an investment for retirees so far. In my opinion, it is a fine investment for younger investors as well. I have quite a while to go before retirement, but I still like healthy dividend yielding companies. Investors concerned about tax consequences should seek advice from someone knowledgeable about their tax situation. Expense Ratio The ETF is posting .07% for an expense ratio. This is great expense ratio. I treat the expense ratio as a very important metric when considering an investment. I want diversification, I want stability, and I don’t want to pay for them. Market to NAV The ETF is at a .02% premium to NAV currently. In my opinion, that’s not worth worrying about. It is practically trading right on top of NAV. However, premiums or discounts to NAV can change very quickly so investors should check prior to putting in an order. Largest Holdings The portfolio isn’t really top heavy. There are no holdings over 4%, but I still could go for slightly more diversification. With so many companies over 2%, the low standard deviation speaks to the stability of the companies within the ETF. (click to enlarge) I love having Exxon Mobil (NYSE: XOM ) as the top holding in the portfolio. I want exposure to gas because high gas prices can slow down the rest of the economy. In my opinion, it is hard to make an argument for any portfolio (under modern portfolio theory) that does not contain at least some exposure to gas prices. In my opinion, XOM is a reasonably safe way to get that exposure. You may notice Chevron is also in there. I think that is great as well. I don’t want to hold just one of the major gas companies. In my opinion, this is a fairly solid lineup. I’m still uncomfortable with Verizon (NYSE: VZ ) because I don’t like that industry in the current environment. However, at less than 2%, I have no problem with including it in a long term ETF position. When the industry becomes attractive again, it should be a great company to hold. Conclusion I’m currently screening a large volume of ETFs for my own portfolio. The portfolio I’m building is through Schwab, so I’m able to trade SCHV with no commissions. I have a strong preference for researching ETFs that are free to trade in my account, so most of my research will be on ETFs that fall under the “ETF OneSource” program. I’m finding SCHV pretty attractive and will consider giving it a niche in my portfolio. The size of the position depends on if I decided to use it as a core holding in place of SPY or SCHB. In that scenario, it could end up with a position as large as 20 to 25%. Otherwise, I would probably aim for something around 10%. Before I make a final decision I’ll need to run some analysis on complete potential portfolios. One way or another, my complete portfolio will include strong exposures to large cap U.S. companies and to heavy dividend paying companies.