Southern Company Will Be Teaming Up With The U.S. Navy And Air Force
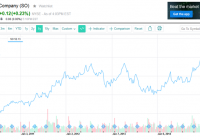
Summary Southern Co. and HelioSage are teaming up with the U.S. Military to develop three solar facilities on military sites across the gulf coast. Southern Co. has taken added interest since the end of QE3 in October 2014, hitting new all-time highs in a fighting market. Southern Co. is a stable long-term stock with a respectable 4.02% dividend. Southern Co. is reporting earnings on February 4, 2015. Here we are, three weeks into the year, and we are working our way through earnings. If this is the first time you have read my articles, I am building a portfolio for 2015 that contains all original research. I am digging through SEC filings and considering the state of the economy. So far, I have written articles about seven stocks and my eighth pick is Southern Co. (NYSE: SO ). I am focusing on long-term growth, diversification, and I love dividend stocks. With the uncertainty of the market right now, I have begun each search with a few primary characteristics of each stock. Aside from the economic state, which is driving me towards oil and retail, I am also looking for stocks that popped around mid-October of last year, and that have weathered the January storm. The reason for this is because October was the end of QE and people reallocated their money, and stocks that gained interest in these time frames are a good indicator of where a lot of it went. I believe that some of the stocks that have done well since that time are likely to continue to rise for the time being. This article will take an objective approach to the company, and raise any potential issues. However, upon evaluation, I believe that the market risks are not of immediate concern, but should be considered when deciding whether to invest or not. A Brief Overview Southern Co. is seen as a secure investment because of its customer base. According to its website : Southern Co. is a leading U.S. producer of clean, safe, reliable and affordable electricity, Southern Company owns electric utilities in four states – Alabama Power , Georgia Power , Gulf Power , and Mississippi Power – and a growing competitive generation company – Southern Power – as well as a licensed operator of three nuclear generating plants – Southern Nuclear – and fiber optics and wireless communications – Southern Telecom and SouthernLINC Wireless , respectively. Their clientele is around 4.4 million and they have nearly 46,000 megawatts of generating capacity. Below is some info about the power subsidiaries. Gulf Power Company (Gulf Power) Gulf power has a variety of power generation sources, and has a focus on Carbon Conscious Energy. Specifically, gas-to-energy, wind and geothermal, and solar are highlighted focuses of the company. Any time a company pairs with the government, many opportunities of expansion are created because the military is seen as a reliable customer once commitments are made. Gulf Power just announced that it is partnering with the U.S. Navy and U.S. Air Force to build solar energy farms within its region. The planned implementation date is December 2016; however, in my experience with the military, it is highly likely that this date may be pushed back. If approved, it will still be a large revenue boost, and there will likely be a reduction in operating costs since solar requires less regulation than other options such as nuclear. It will not replace other forms of energy at the moment, but will supplement them. Georgia Power Company (Georgia Power) Georgia power services 2.3 million customers as of December 31, 2013. The majority of the customers are serviced in metro regions, with the fewest customers in Southern Georgia. Total Georgia Power kW Capacity Hydro 1,087,536 Fossil 8,791,427 Nuclear 1,959,852 Solar 705 Other (Diesel, Combined Cycle and Combustion Turbine) 5,746,409 Total 17,585,929 Although solar is the smallest of the generating capacity, Southern Co. has made it clear that solar is one of the focuses of the company as the country moves towards cleaner, safer forms of energy. Georgia power has an initiative called the “Georgia Power Advanced Solar Initiative (GPASI).” 2015 will begin the first year that four Power Purchase Agreements (PPA) will take effect totaling 50 MWs of utility scale solar generation to be purchased by the company. Southern Power Company (Southern Power) Southern Power recently announced plans to develop a 131MW PV solar project in Georgia. The electricity will power 21,000 homes and will be sold to three Georgia electric membership corporations. First Solar will be the engineer and contractor. Plans to begin this project are set for September, 2015. There will be approximately 1.6 million thin-film PV solar modules mounted on single-axis tracking tables. Alabama Power Company (Alabama Power) Alabama Power is the second largest subsidiary of Southern Company and its customer base is approximately 1.4 million homes, businesses and industries in the southern two-thirds of Alabama. There are 24 generating plants that range from Hydro, Coal/Gas, Gas, and Nuclear. The single nuclear plant has a total nameplate generating capacity of 1,720,000 KW. One concern is that with the major earthquake and tsunami that struck Japan, operating expenses may rise once reviews are complete of nuclear facilities in the US. This may result in higher capital requirements and increased costs associated with ensuring safety. Many of the capital expenditures include investments to comply with environmental regulations. Mississippi Power Company (Mississippi Power) Mississippi Power is another subsidiary of Southern Co. that operates utilizing multiple fuel sources. You will notice that the diversification of fuel sources is intentional, so that the distribution of each source can be modified to adjust to current price trends. Lignite, natural gas, and traditional coal are the primary sources of energy with 70% of the customers being fueled by natural gas. Mississippi Power is currently working on a $6.1 billion, 582-megawatt power plant in Kemper, Miss. This has contributed to increases in debt load and the costs have surpassed expectations. It has a coal gasification design called Transport Integrated Gasification. It will tap into lignite reserves, which will reduce shipping costs and stabilize prices in the long term. The progress of this project is important because of the sheer scope and cost. Another important factor will be the recapturing of CO2. The company will need to ensure that this new plant is able to capture the targeted amount (65%) because if there is any excess or does not comply with regulations, it could become a target, upping the cost even more. The projected completion date is mid-2016. The Commonality One common theme throughout all of these companies is the level of debt currently held by the company. The debt level has grown steadily over the past several years. The 2013 annual report reflects a total debt of $23.395 billion. In a low interest climate, this is OK, but this is something they will need to keep under control in a rising interest climate. An important point on their debt though is some of the forms of debt they hold. For example, Alabama Power established a wholly-owned trust to issue preferred securities. The investment in the trust is reflected as other investments, and the related loan from the trust is reflected as long-term debt. This total was $206 million as of December 31, 2013. A tactic used to maintain the control of debt in Alabama Power is through the conversion of long-term debt to short-term debt. While this is not generally a good practice, there are strategic reasons why this could be a good decision. From 2014-2016, the debt maturities are expected to exceed operating cash flows. The solution to this is for the company to take out short-term debts to cover longer-term debts. With the seasonality of the business, this is necessary and while interest rates are low, this tactic will benefit the business. Short-term cash needs are met through the paper program and through a SO subsidiary organized to issue and sell commercial paper at the request of the company. There are very specific actions being taken to ensure debts are taken care of and after their current projects are completed and implemented, the expectation is that some of the debts should decline. In the meantime, it is important to keep an eye on the allocation of their cash flows and how they control their debts. More items to consider are investments that are made to comply with imposed regulations. As mentioned previously, as CO2 emissions gain the attention of politicians, it will affect the operations of companies like SO. Swings in weather are generally good for power companies since colder days or hotter days require the use of either a heater or air conditioning. However, major disasters can have a drastic effect on SO (note the location of the nuclear power plant on the coast). Finally, I mentioned interest rates assisting or hurting their ability to pay off debts, this trickles down to the bottom line and expect EPS to be effected by the rise in interest rates that may come within the next year. Should I Buy It? (click to enlarge) The stock currently has an attractive dividend yield of 4.03% and a PE ratio of 21.4. Currently there are 2 analysts that rate Southern Co. as a buy, 4 analysts rate it a sell, and 8 rate it a hold. A look at the charts from 2014 makes it seem a bit rich for the typical growth of a utility company; however, expanding back to 2010 and before yields more information. A long, drawn out correction from 2012-2014 has given the stock room to grow in the near-term. Southern Co. has been reaching new all-time highs on a regular basis and is trading above both 50 and 200-day SMAs. The future growth will most likely not happen as quickly as the last year. In fact, the stock is due for a correction. While it is currently a bit pricey, the revenue growth has shown superior growth to the industry average of 5.8%. SO is sitting at 6.4%, and as a long-term growth strategy, this could be a promising company to hold for years. The future earnings potential are dependent upon a number of factors mentioned previously and since prices are regulated by the FERC, retail rates may be adjusted as necessary to accommodate the current economic climate. Earnings are due to be reported on February 4, 2015 and this should give a good indicator of where the company will go from here. Regardless of the earnings results, this stock is a wait and see in the short term, but I will buy it for the long term. In the event of negative earnings press, I will wait until after the stock has declined and shown support multiple times before purchasing it. In the event of an earnings beat, I may wait a bit longer until a reasonable correction has occurred.