Tag Archives: nreum

6 High-Yield Bond CEFs Trump ETFs Like HYG And JNK

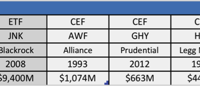
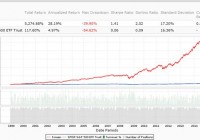
Summary After a late 2014 sell-off, high yield bond funds currently offer very attractive mid- to high single-digit yields. Though they contain significant exposure to credit risk, high yield bonds have a relatively low sensitivity to rising interest rates. Investors interested in ETFs like HYG or JNK should consider the more than 30 closed-end funds that focus on high yield debt. Because of their unique structure, closed-end bond funds are able to generate substantially higher distribution income, sometimes with less credit or interest rate risk. High-Yield Bonds can be an important addition to a diversified taxable income-seeking portfolio, generating significant yields with less interest rate risk than alternatives including government or investment grade corporate funds. Accordingly, leading High-Yield Bond ETFs like SPDR Barclays Capital High Yield Bond ETF (NYSEARCA: JNK ) and iShares iBoxx $ High Yield Corporate Bond ETF (NYSEARCA: HYG ) have accumulated combined assets of more than $24 billion. However, investors – especially individual investors – in JNK and HYG should consider the closed-end fund alternatives for high yield bond income. This article will examine six closed-end funds that specialize in high yield bonds that provide superior yields with a similar risk profile. For an in-depth examination of the risks and rewards of high yield bond CEFs please refer to “In Search of Income: High Yield Bond CEFs Part I & Part II . Understanding the Closed-End Fund Structure Closed-End Funds (CEFs) are a form of mutual funds that have existed in the United States since 1893. While CEFs are actually the “original” type of mutual fund traded on US exchanges, they are far less common than the “open-ended” type of mutual funds that most investors associate with the term “mutual fund”. CEFs represent less than 2% ($298 billion) of the $15 trillion mutual fund market. CEFs are used for a variety of active strategies in both the equity and fixed income categories, and are most commonly associated with income generating strategies such as high yield bond investing. The closed-end fund structure is unique among market-listed fund structures because of its combination of three characteristics: Permanent capital – CEFs issue a fixed number of shares at IPO and do not subsequently create or redeem shares except in rare instances. This provides fund managers with permanent capital that is not subject to the whims of investor redemption requests. Continuous trading / market pricing – investors that want to transact shares of a CEF do so on the open market at any point during trading hours, buying from and selling to other individual market participants. Importantly, this leads to the existence of divergences between share price and share value NAV. Use of Leverage – CEFs frequently choose to use moderate amounts of leverage to enhance returns on investor capital. While this does also increase risk and volatility, this leverage can be attractive to investors because borrowing costs required to support it tend to be much lower than any alternative source of leverage financing accessible to individual investors. Closed-end funds and Exchange-Traded Funds are often compared to mutual funds because each type often focuses on a particular sector of the market. Perhaps because the mutual fund industry historically enjoyed high fees, sales loads and profitability the exchanged traded funds focusing on similar sectors have grown in popularity. However, the Closed-End Fund segment is often overlooked for investors interested in a specific sector. Advantages vs. ETFs – Exchange traded funds have exploded in popularity in the past two decades in part because they are exceptionally cost/tax efficient ways to get exposure to certain passive strategies. However, the CEF structure has several advantages over ETFs when investing in segments such as high yield debt. First, CEFs are actively managed, enabling seasoned fixed income portfolio managers to select specific attractive bond issues rather than “buying the market” as an index fund does. Second, CEFs have permanent capital not subject to redemptions which is of particular importance in sectors like high yield debt, where herd mentality can lead to investor redemptions at precisely the moment when bonds are least easily sold, and can make it hardest for ETF managers to “be greedy when the market is fearful”. CEF managers have ability to ride out – and capitalize on – these panics. Third, CEFs are able to employ low-cost leverage to enhance returns. Finally, because CEFs trade a prices significantly different (and typically lower) than their net asset values, savvy investors have opportunity to earn greater yields (earn the income on $100 of bonds with only $90 of investment) as well as potential for capital appreciation. Advantages vs. Mutual Funds – Standard Mutual funds, technically classified as “open-end mutual funds”, offer tremendous variety of both active and passive strategies. However, closed-end funds have several advantages on them as well. In addition to the permanent capital, leverage, and discount pricing described above, CEFs offer continuous liquidity and the ability to control price at which you buy and sell with limit orders, rather than once daily trading after market hours at “blind” prices. Comparing Investment Options With those structural differences in mind, we’ll compare two of the largest high yield bond ETFs, iShares iBoxx $ High Yield Corporate Bond ETF and SPDR Barclays Capital High Yield Bond ETF , to six leading high yield closed-end funds ( AWF , GHY , HIO , IVH , NHS , and HYI ). While the selected funds represent only 6 of 33 CEFs in the High Yield category, they provide a good cross-section of fund sponsors, sizes, and risk metrics. (click to enlarge) Income Generation The principal motivation for owning high yield bond funds is, unsurprisingly, high yield. Many high-yield ETF investors may be surprised to find that CEF offerings in the High Yield Bond segment offer substantially higher risk adjusted yields than their ETF counterparts. While there are many factors to consider in comparing the opportunities and risks presented by ETFs and CEFs, the 250+ basis point difference in yield is hard to ignore. (click to enlarge) Note that, because they are actively managed, closed-end fund distributions at times the include return of capital, long-term capital gains or short-term capital gains. However, for the funds we are examining, those factors are virtually insignificant, as shown in the below table. (click to enlarge) Price to Value (aka the closed-end discount) As mentioned above, a core feature of closed-end funds is their tendency to trade at prices that vary considerably from their underlying value, or NAV. This difference is commonly referred to as the premium (or discount) to NAV. When prices are below NAV (which historically has been the case about 90% of the time), the discounts created create two major advantages for CEF investors. First, purchasing at a discount enhances yields since an investor can own the rights to the income generated from a hypothetical $10 of net assets with only $9 of investment. Second, for investors willing to actively manage their holdings, funds purchased at particularly wide discounts can be sold at narrower discounts – or even premiums – for capital gain treatment that enhance the after tax returns from a fund. High yield bond CEF discounts are currently in the 10% range, though wide variation exists. ETFs rarely have meaningful or sustained discounts to NAV. (click to enlarge) Risks Return potential from an investment must be viewed in the context of the risk investors are taking. Bond investors are primarily exposed to two types of risk: (1) default risk, as measured by credit rating, and (2) interest rate risk, as measured by “duration”. The high yield bond sector generally carries moderate to high default risk (the “junk” in junk bonds…) but tend to have low durations, and thus low interest rate risks. As many investors are concerned about the specter of interest rate increases, the shorter duration of all funds – CEF and ETF alike – in the category is attractive to many. Comparing across funds, CEFs are generally equivalent on credit rating and superior on duration, in many cases even when the amplification effect of leverage is considered. (click to enlarge) Expenses Because CEFS are actively managed, adjusted expense ratios typically exceed ETFs by 50-100 basis points. While index ETF fees are 0.4 to 0.5%, CEFs range from a little less than 1% to little more than 1.5%, after adjustment for cost of leverage. (click to enlarge) * According to Morningstar: “By regulation, closed-end funds utilizing debt for leverage must report their interest expense as part of expense ratio. This happens even if the leverage is profitable. Funds utilizing preferred shares or non-1940 Act leverage are not required to report the cost of leverage as part of expense ratio. To make useful comparison between closed-end funds and with both open-end funds and exchange-traded funds, the adjusted expense ratio excludes internal expense from the calculation. In addition, we adjust the calculation’s denominator, basing it on average daily net assets.” Conclusion The high yield bond sector is interesting at current – regardless of investment vehicle chosen – because of its relative lack of interest rate risk and its recent re-pricing in response to the falling price of oil. Investors considering high yield ETFs should give a close look at the CEF alternatives, primarily for the enhanced income distributions and secondarily for the potential gain from a narrowing price discount.

How To Design A Market Neutral Portfolio – Part 3

Summary How to build a robust long side. Which ETF on the short side. How to make it IRA-compliant. The first article of the series described the investor profile to hold a market neutral portfolio, some characteristics of this investing style. The second one explained the benefit of sector diversification, with examples. This one simulates solutions for the hedging position with various ETFs: leveraged and non leveraged, inverse and regular. People implementing an equity market neutral strategy usually have two balanced sets of individual stocks on both sides (long and short). Before going to the point, I want to come back on the reason why I prefer a single index ETF position on the short side. My opinion is that ‘Market Neutral’ is for risk-averse investors. Therefore it is also better to avoid a potentially unlimited risk that is not related to the market: being trapped in a short squeeze. People who think that this risk is limited to penny stocks and small caps have a short memory, or don’t know some cases. My preferred example is the ‘mother of all short squeezes’ that happened in 2008 when Volkswagen AG became briefly the highest capitalization in the world after its share price was multiplied by five in 2 days. Then it fell back to its initial level even more quickly. In the interval, investors and traders on the short side covered their positions at any price with huge losses, in panic or forced by their brokers. Whatever the reason (in this case a corner engineered by a major shareholder), and the consequences (at least a suicide has been attributed to that), I prefer avoiding by design this kind of event. Even absorbed in a diversified portfolio, such a shock hurts and may trigger a margin call for leveraged investors. On the long side… The quantitative models used for the long side of my real market neutral portfolio will not be disclosed here. However, I want to share some of its characteristics that may be reused by readers in another context. The portfolio is based on 5 different models: 2 with defensive stocks, 2 with cyclical stocks, 1 based on growth and valuation with no sector limitation. All models are based on rankings using fundamental factors. 24 stocks are selected: 14 in the S&P 500 index, 5 in the Russell 1000 index, 5 in the Russell 3000 index. The number of stocks has been chosen to limit the idiosyncratic risk. The sector diversification pattern should help beat the hedge in most phases of the market cycle. The diversification in rankings across models should limit the risk of over-optimization. The focus on large capitalizations is a choice of comfort (for myself) and ethic (for subscribers). Russell 3000 stocks are filtered on their average dollar daily volume. The portfolio is rebalanced weekly, but backtests show that a bi-weekly rebalancing doesn’t hurt the long-term performance. However, the hedge should always be rebalanced weekly. The next chart shows the simulation of this 24-stock portfolio (long side only) since 1999, with a 0.3% transaction cost and a 2-week rebalancing: (click to enlarge) Past performance, real or simulated, is never a guarantee of future returns. However, for a diversified portfolio like this one, it gives some clues about the robustness. Especially when robustness has been integrated from the design process, not just as the result of backtest optimization. On the short side… Some readers will be scared if I tell them abruptly that I use a leveraged 3x inverse ETF. Most people who are afraid of leveraged ETFs don’t really understand where their ‘decay’ comes from. If you exclude the management fee (under 1% a year), the decay has two names: roll-over cost and beta-slippage. The holdings of leveraged S&P 500 ETFs (inverse and regular) are swaps for the biggest part, and futures in second position. Rollover costs are close to zero for such contracts on the S&P 500. For beta slippage, some of my old articles have already explained what it is , and why I don’t fear it on S&P 500 leveraged ETFs. In short: most leveraged ETFs are harmful as long term holdings, but not all of them. The next table is a summary of backtests for the portfolio with different hedges, period 1/1/1999 to 11/29/2014 (weekly rebalancing). The ETF used are the ProShares Short S&P 500 ETF ( SH), the ProShares UltraShort S&P 500 ETF ( SDS), the ProShares UltraPro Short S&P 500 ETF ( SPXU) and the ProShares UltraPro S&P 500 ETF ( UPRO). For most cases it shows the performance without leverage, and with a leverage factor corresponding to holding the stocks on capital and the hedge on margin. Price data are synthetic before the inception dates (calculated by data provider). Hedge Leverage An.Ret. (%) DD (%) DL (weeks) K (%) No no 28 36 103 24 SH no 10 10 54 25 SH 2 23 23 54 25 SDS no 14 12 54 28 SDS 1.5 21 17 54 28 SPXU no 15 9 54 30 SPXU 1.33 21 11 54 30 UPRO (short) no 16 8 51 33 UPRO (short) 1.33 22 10 51 33 SPXU 50% no 20 17 51 34 SPXU 50% 1.167 24 19 51 34 SPXU 75% no 17 11 49 33 SPXU 75% 1.25 23 14 50 33 SPXU Timed no 25 15 50 34 SPXU HalfTimed no 20 10 48 36 SPXU HalfTimed 1.33 28 13 49 36 An.Ret.: annualized return DD: max drawdown depth on rebalancing (it may be deeper intra-week) DL: max drawdown length K: Kelly criterion of the weekly game, an indicator of probabilistic robustness The ‘Timed’ version uses a signal based on the 3-month momentum of the aggregate S&P 500 EPS and the U.S. unemployment rate. ‘Half Timed’ means that 50% of the hedging position is permanent, the other 50% is timed. Among the 100% market neutral versions, shorting UPRO looks better at first sight… but it is not after taking into account the borrowing rate (4.48% last time I had a look at UPRO properties in InteractiveBrokers platform). As it represents 25% of the total portfolio, the drag on the portfolio annual return is about 1%, which gives the same performance as with SPXU. I prefer buying SPXU and eliminating the inherent risk of short selling. Moreover, U.S. tax-payers can implement this kind of strategy in an IRA account if they use SPXU. Such a portfolio can be traded without leverage, but cash and IRA accounts usually have a 3-day settlement period. It is recommended trading at a broker offering a limited margin IRA feature waiving the settlement period and the risk of free-riding. It seems that Interactive Brokers and TD Ameritrade do that (and maybe others). Inform yourself carefully. Data and charts: Portfolio123 Additional disclosure: Long SPXU as a hedge.

Fund Watch: Gotham, Transamerica, Highland, ALPS And More

In this edition of Fund Watch, we preview new fund filings from: Eccles Street Event-Driven Opportunity ETF Transamerica Event Driven Fund ALPS Advanced Put Write Strategy ETF Gotham Index 500 and Total Return Funds Highland Files for 17 Alternative ETFs Eccles Street Event-Driven Opportunity ETF Eccles Street Asset Management filed paperwork with the Securities and Exchange Commission (SEC) on January 9, announcing its intention to launch the Eccles Street Event-Driven Opportunity ETF. Eccles Street will invest the fund’s assets in “event-driven” credit instruments, mostly corporate bonds and bank loans with an average maturity of 3-5 years. The instruments are considered “event-driven” because their issuers are involved in corporate “events,” such as mergers, acquisitions, bankruptcies, credit downgrades, proxy fights, or other restructuring. The Eccles Street Event-Driven Opportunity ETF will also invest in equities, especially credit-related ETFs and ETNs. Investments will be selected after Eccles Street Management, the fund’s sub-advisor, performs a credit analysis of the issuers of potential investments. The fund’s objective will be current income, with a secondary objective of capital appreciation. Transamerica Event Driven Fund Transamerica Funds filed a Registration Statement with the SEC for the Transamerica Event-Driven Fund on January 15. The fund will be sub-advised by Advent Capital Management, and it will pursue an event-driven strategy by investing in companies involved in corporate events or special situations. Absolute return is the fund’s objective. The Transamerica Event-Driven Fund will be available in A- and I-class shares, with net-expense ratios of 1.6% and 1.35%, respectively. Advent Capital Management’s Odell Lambroza, Tracy Maitland, and Doug Teresko are listed as the fund’s portfolio managers. ALPS Advanced Put Write Strategy ETF On January 6, ALPS ETF Trust filed a Form N-1A with the SEC announcing its plan to launch the ALPS Advanced Put Write Strategy ETF. The fund will seek total return, with an emphasis on income, by writing one-month put options on the SPDR S&P 500 Trust ETF (NYSEARCA: SPY ) . To write a put option is the same thing as short-selling a put option, and the ALPS Advanced Put Write Strategy ETF earns income by writing (short-selling) puts, effectively on the S&P 500. Put options rise in value as the value of their underlying instrument declines, and fall in value as their underlying instrument appreciates. The objective of a put writer is for the put contracts he or she sells short to expire worthless. The ALPS Advanced Put Write Strategy ETF will give investors the opportunity to earn income from unrealized fears as the S&P 500 climbs higher. Gotham Index 500 and Total Return Funds On January 15, Fundvantage Trust filed paperwork with the SEC for a pair of new alternative mutual funds: the Gotham Index 500 Plus Fund and the Gotham Total Return Fund. Author and former hedge-fund manager Joel Greenblatt is a co-portfolio manager of both funds. The Gotham Index 500 Plus Fund seeks to outperform the S&P 500 over most investment periods by using a long/short equity strategy. In addition to shares of common stock, its investments may include preferred stock, convertible bonds, rights, and warrants – all of which are featured in portfolio manager Joel Greenblatt’s 1997 book You Can Be a Stock-Market Genius . The Gotham Total Return Fund will be a non-diversified fund aiming to outperform the top-ranked university endowments over a full market cycle. Its assets will be allocated across other Gotham mutual funds, particularly the Gotham Absolute 500 Fund, the Gotham Enhanced 500 Fund, the Gotham Neutral Fund, and the new Gotham Index 500 Plus Fund. The fund’s long equity exposure is expected to be between 40% and 80%. Highland Files for 17 Alternative ETFs Highland Capital Management has made a big commitment to liquid alternatives space with a new filing for 17 ETFs that span across four broad hedge funds styles, including equity hedge, event driven, macro and relative value. The full list of funds is as follows: Highland Equity Hedge Fundamental Growth ETF Highland Equity Hedge Fundamental Value ETF Highland Equity Hedge Multi-Strategy ETF Highland Equity Hedge Technology ETF Highland Equity Hedge Healthcare ETF Highland Event-Driven Activist ETF Highland Event-Driven Credit Arbitrage ETF Highland Event-Driven Merger Arbitrage ETF Highland Event-Driven Multi-Strategy ETF Highland Macro Discretionary Thematic ETF Highland Macro Multi-Strategy ETF Highland Relative Value Fixed-Income Asset Backed ETF Highland Relative Value Fixed-Income Convertible Arbitrage ETF Highland Relative Value Fixed-Income Corporate ETF Highland Relative Value Fixed-Income Sovereign ETF Highland Relative Value Volatility ETF Highland Relative Value Multi-Strategy ETF Highland currently has one ETF in the market, the Highland iBoxx Senior Loan ETF (NYSEARCA: SNLN ), along with a range of alternative strategy and alternative income mutual funds. The launch of 17 alternative ETFs will make Highland one of the largest managers of alternative ETFs in the market.