Tag Archives: nyseawf

NCZ: Is It Time To Enjoy This Fund’s 14% Distribution?

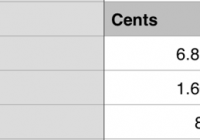
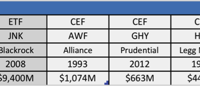
Summary NCV and NCZ offer yields over 13% and near 14% on a diversified corporate bond and convertible bond portfolio. The NAV of both funds has fallen over 6% YTD and premiums have fallen as the funds and corporate bonds have fallen out of favor. Despite these risks, both funds offer a sustainable payout thanks to previous purchases of bonds at modest discounts. Allianz Global Investors offers two funds with very high distributions and similar investment objectives: the AllianzGI Convertible & Income Fund (NYSE: NCV ) and AllianzGI Convertible & Income Fund II (NYSE: NCZ ). The funds get little attention, with average daily volume of a little over 400,000 shares and few articles on this site. The lack of attention is unfair to these funds because, despite the risks involved, they currently trade at a relatively low premium and offer monthly payouts that can buttress an income portfolio without significant risk of a dividend cut in the near term. Instead of a dividend haircut, the bigger risk in both funds is the depletion of net assets, which have fallen 6.5% year-to-date for NCZ and 6% for NCV, according to Allianz’s website (for NCZ ). These are real risks to consider before investing in either fund, although I will not discuss what has driven this trend or whether it is likely to continue in this article. Instead, I want to focus on the sustainability of these funds’ payouts over the next three years by taking a closer look at NCZ. I am choosing this fund because its higher payout (13.9%) will make it more attractive to investors at first glance, although its premium to NAV (5.2%) is higher than its sibling’s premium (NCV is at a 1.9% premium), which would also imply that it offers less value at the moment. For a rundown of the virtues of NCV, the recent article by Betalyst is valuable and illuminating. The Sustainability of the Payout As with all high yield funds, there is substantial fear that these funds’ monthly payouts are unsustainable. NCZ’s distributions to NAV ratio is 14.4%, while the fund’s 33% leverage puts the fund at risk of destructions to the fund’s value if its holdings fall too low in value or default rates spike. Nonetheless, the distribution to NAV ratio is misleading, because the fund has partly funded distributions from capital paid in excess of par. These payments are not returns of capital; they are profits from sold bonds and convertible notes that the fund has held and liquidated. These accounted for 18.9% of the fund’s total payouts in June. Excluding this, we see that the fund’s net investment income to NAV ratio is a much more modest 11.68%: (click to enlarge) With both of these income sources, the fund is earning enough to cover distributions. Thanks to the fund’s past investments, it is able to earn 11.68% on its bond holdings, while bumping returns higher with gains from selling issues above par. Since the fund’s average coupon rate is 7.52%, it is clear that the fund is buying its holdings at a discount. How much of a discount does the fund need to get in the market to sustain its payouts? This is an important question, because the larger the discount, the greater the default risk (at least in theory) and the greater the risk profile of the fund. The fund’s current NII comes out to less than what the fund would get if it purchased issues at an average 3% discount, so the fund is buying bonds at a relatively small discount. This also means the fund’s ability to earn more NII will increase substantially if it finds more issues trading at an even higher discount: With corporate yields rising, the opportunity to buy more bonds in the secondary market at a discount will only increase. As a result, NCZ will be able to make new purchases at steeper discounts and higher yields, although its high use of leverage of course limits how much it can buy. NCV is similarly using 33% leverage and may be limited in purchasing power; on this point, the PIMCO High Income Fund (NYSE: PHK ) is slightly better positioned to buy issues at discounts, thanks to its 29% leverage. Better still are the PIMCO Income Strategy Fund II (NYSE: PFN ) with 23.3% leverage and the AllianceBernstein Global High Income (NYSE: AWF ) with 14.15% leverage. Other funds from other firms may also be well positioned to buy more issues at discounts in the future. Even with its high leverage and limited buying power, both NCZ and NCV should have no difficulty maintaining income payouts with their current holdings, and the low average duration of the funds’ portfolios (2.4 years for NCZ and 2.41 for NCV) suggest that both will have freed up capital in the medium term. If the economy improves and Treasury and corporate bond yields rise throughout 2017 and beyond, the fund will be ideally positioned to buy more issues at higher rates. On this point, it is worth noting that yields on corporate bonds have already begun to rise from the year’s lows: (click to enlarge) Additionally, as of the end of Q1’15, the fund had 10.07 cents in undistributed net investment income (UNII) that it can deploy if necessary. While investors often take solace in UNII, this should not be the primary focus of an investment decision, since UNII tends to be lumpy and too much UNII can indicate an inefficient use of capital. Nonetheless, this buffer does indicate a bit of safety with the fund’s distributions in a pinch, although no pinch is expected by most in the market, regardless of sensationalist headlines about Greece, China and the NYSE blackout. Conclusion: NCV or NCZ? With the similarities of both funds, investors looking for a high monthly distributions may find it difficult to choose between the two. At the moment, NCV is trading at a premium of less than 1%, while NCZ is trading at a 5.2% premium. For those who abhor buying CEFs at a premium, NCV may be more tolerable; for those looking for a high yield in the short term, NCZ may be more appropriate. However, if you believe interest rates are going to rise in the short term and the value of these funds’ holdings will fall, both face the threat of further declines in the short term as NAV has fallen 6.5% year-to-date. If not, these funds can be an attractive addition to an income-producing portfolio on their ability to maintain payouts and see NAVs rise when redemptions come and issues at higher rates are for sale. Disclosure: I/we have no positions in any stocks mentioned, but may initiate a long position in NCV over the next 72 hours. (More…) I wrote this article myself, and it expresses my own opinions. I am not receiving compensation for it (other than from Seeking Alpha). I have no business relationship with any company whose stock is mentioned in this article.

6 High-Yield Bond CEFs Trump ETFs Like HYG And JNK

Summary After a late 2014 sell-off, high yield bond funds currently offer very attractive mid- to high single-digit yields. Though they contain significant exposure to credit risk, high yield bonds have a relatively low sensitivity to rising interest rates. Investors interested in ETFs like HYG or JNK should consider the more than 30 closed-end funds that focus on high yield debt. Because of their unique structure, closed-end bond funds are able to generate substantially higher distribution income, sometimes with less credit or interest rate risk. High-Yield Bonds can be an important addition to a diversified taxable income-seeking portfolio, generating significant yields with less interest rate risk than alternatives including government or investment grade corporate funds. Accordingly, leading High-Yield Bond ETFs like SPDR Barclays Capital High Yield Bond ETF (NYSEARCA: JNK ) and iShares iBoxx $ High Yield Corporate Bond ETF (NYSEARCA: HYG ) have accumulated combined assets of more than $24 billion. However, investors – especially individual investors – in JNK and HYG should consider the closed-end fund alternatives for high yield bond income. This article will examine six closed-end funds that specialize in high yield bonds that provide superior yields with a similar risk profile. For an in-depth examination of the risks and rewards of high yield bond CEFs please refer to “In Search of Income: High Yield Bond CEFs Part I & Part II . Understanding the Closed-End Fund Structure Closed-End Funds (CEFs) are a form of mutual funds that have existed in the United States since 1893. While CEFs are actually the “original” type of mutual fund traded on US exchanges, they are far less common than the “open-ended” type of mutual funds that most investors associate with the term “mutual fund”. CEFs represent less than 2% ($298 billion) of the $15 trillion mutual fund market. CEFs are used for a variety of active strategies in both the equity and fixed income categories, and are most commonly associated with income generating strategies such as high yield bond investing. The closed-end fund structure is unique among market-listed fund structures because of its combination of three characteristics: Permanent capital – CEFs issue a fixed number of shares at IPO and do not subsequently create or redeem shares except in rare instances. This provides fund managers with permanent capital that is not subject to the whims of investor redemption requests. Continuous trading / market pricing – investors that want to transact shares of a CEF do so on the open market at any point during trading hours, buying from and selling to other individual market participants. Importantly, this leads to the existence of divergences between share price and share value NAV. Use of Leverage – CEFs frequently choose to use moderate amounts of leverage to enhance returns on investor capital. While this does also increase risk and volatility, this leverage can be attractive to investors because borrowing costs required to support it tend to be much lower than any alternative source of leverage financing accessible to individual investors. Closed-end funds and Exchange-Traded Funds are often compared to mutual funds because each type often focuses on a particular sector of the market. Perhaps because the mutual fund industry historically enjoyed high fees, sales loads and profitability the exchanged traded funds focusing on similar sectors have grown in popularity. However, the Closed-End Fund segment is often overlooked for investors interested in a specific sector. Advantages vs. ETFs – Exchange traded funds have exploded in popularity in the past two decades in part because they are exceptionally cost/tax efficient ways to get exposure to certain passive strategies. However, the CEF structure has several advantages over ETFs when investing in segments such as high yield debt. First, CEFs are actively managed, enabling seasoned fixed income portfolio managers to select specific attractive bond issues rather than “buying the market” as an index fund does. Second, CEFs have permanent capital not subject to redemptions which is of particular importance in sectors like high yield debt, where herd mentality can lead to investor redemptions at precisely the moment when bonds are least easily sold, and can make it hardest for ETF managers to “be greedy when the market is fearful”. CEF managers have ability to ride out – and capitalize on – these panics. Third, CEFs are able to employ low-cost leverage to enhance returns. Finally, because CEFs trade a prices significantly different (and typically lower) than their net asset values, savvy investors have opportunity to earn greater yields (earn the income on $100 of bonds with only $90 of investment) as well as potential for capital appreciation. Advantages vs. Mutual Funds – Standard Mutual funds, technically classified as “open-end mutual funds”, offer tremendous variety of both active and passive strategies. However, closed-end funds have several advantages on them as well. In addition to the permanent capital, leverage, and discount pricing described above, CEFs offer continuous liquidity and the ability to control price at which you buy and sell with limit orders, rather than once daily trading after market hours at “blind” prices. Comparing Investment Options With those structural differences in mind, we’ll compare two of the largest high yield bond ETFs, iShares iBoxx $ High Yield Corporate Bond ETF and SPDR Barclays Capital High Yield Bond ETF , to six leading high yield closed-end funds ( AWF , GHY , HIO , IVH , NHS , and HYI ). While the selected funds represent only 6 of 33 CEFs in the High Yield category, they provide a good cross-section of fund sponsors, sizes, and risk metrics. (click to enlarge) Income Generation The principal motivation for owning high yield bond funds is, unsurprisingly, high yield. Many high-yield ETF investors may be surprised to find that CEF offerings in the High Yield Bond segment offer substantially higher risk adjusted yields than their ETF counterparts. While there are many factors to consider in comparing the opportunities and risks presented by ETFs and CEFs, the 250+ basis point difference in yield is hard to ignore. (click to enlarge) Note that, because they are actively managed, closed-end fund distributions at times the include return of capital, long-term capital gains or short-term capital gains. However, for the funds we are examining, those factors are virtually insignificant, as shown in the below table. (click to enlarge) Price to Value (aka the closed-end discount) As mentioned above, a core feature of closed-end funds is their tendency to trade at prices that vary considerably from their underlying value, or NAV. This difference is commonly referred to as the premium (or discount) to NAV. When prices are below NAV (which historically has been the case about 90% of the time), the discounts created create two major advantages for CEF investors. First, purchasing at a discount enhances yields since an investor can own the rights to the income generated from a hypothetical $10 of net assets with only $9 of investment. Second, for investors willing to actively manage their holdings, funds purchased at particularly wide discounts can be sold at narrower discounts – or even premiums – for capital gain treatment that enhance the after tax returns from a fund. High yield bond CEF discounts are currently in the 10% range, though wide variation exists. ETFs rarely have meaningful or sustained discounts to NAV. (click to enlarge) Risks Return potential from an investment must be viewed in the context of the risk investors are taking. Bond investors are primarily exposed to two types of risk: (1) default risk, as measured by credit rating, and (2) interest rate risk, as measured by “duration”. The high yield bond sector generally carries moderate to high default risk (the “junk” in junk bonds…) but tend to have low durations, and thus low interest rate risks. As many investors are concerned about the specter of interest rate increases, the shorter duration of all funds – CEF and ETF alike – in the category is attractive to many. Comparing across funds, CEFs are generally equivalent on credit rating and superior on duration, in many cases even when the amplification effect of leverage is considered. (click to enlarge) Expenses Because CEFS are actively managed, adjusted expense ratios typically exceed ETFs by 50-100 basis points. While index ETF fees are 0.4 to 0.5%, CEFs range from a little less than 1% to little more than 1.5%, after adjustment for cost of leverage. (click to enlarge) * According to Morningstar: “By regulation, closed-end funds utilizing debt for leverage must report their interest expense as part of expense ratio. This happens even if the leverage is profitable. Funds utilizing preferred shares or non-1940 Act leverage are not required to report the cost of leverage as part of expense ratio. To make useful comparison between closed-end funds and with both open-end funds and exchange-traded funds, the adjusted expense ratio excludes internal expense from the calculation. In addition, we adjust the calculation’s denominator, basing it on average daily net assets.” Conclusion The high yield bond sector is interesting at current – regardless of investment vehicle chosen – because of its relative lack of interest rate risk and its recent re-pricing in response to the falling price of oil. Investors considering high yield ETFs should give a close look at the CEF alternatives, primarily for the enhanced income distributions and secondarily for the potential gain from a narrowing price discount.