Tag Archives: nreum

Managed High Yield Plus Fund: A 9% Yield And A 12.5% Discount Is Hard To Resist

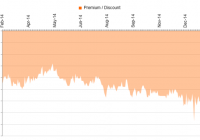
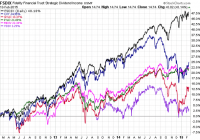
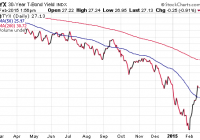
Investors are showing renewed interest in high-yielding junk bonds. With yields of government bonds near record lows, high yield bonds look increasingly attractive. Concerns about exposure to the energy sector appear overblown, especially as oil is now rebounding. Closed end funds offer some of the highest yields and still trade at significant discounts to net asset value. The Managed High Yield Plus Fund offers a rare combination of high yields and professional management, while trading at a major discount to net asset value. Managed High Yield Plus Fund (NYSE: HYF ) is a closed end fund or “CEF” that is professionally managed by UBS (NYSE: UBS ). It primarily invests in high yield bonds and offers a generous yield of nearly 9%. Besides the high yield, there are a couple of other compelling factors, including the fact that this fund pays the dividend on a monthly basis and it is trading at a historically wide discount of about 12.5%, to net asset value. The dividend also appears secure since this fund is earning more each month than it pays out. Let’s take a closer look: (click to enlarge) As the chart above shows, this closed end fund is currently trading for an exceptionally large discount to net asset value and one that is historically wide. The 3-year average discount to net asset value has been 5.78% and the 5-year average has been less than 2%. With the discount now at nearly 12.5%, this appears to be an exceptional buying opportunity. As of February 14, 2015, the net asset value is $2.18 per share and yet these shares are trading for just $1.91 per share. It’s worth noting that this fund has average earnings per share of about 1.37 cents per month, which clearly more than covers the monthly dividend it pays. That is important because it shows that the dividend is secure, and this reduces potential downside risks for investors. To see this and other information, you can see this fund data . This fund has around 359 holdings, which shows it is well-diversified. This diversification reduces potential downside risks for investors. Another consideration for bond investors is duration risk, however, this fund has an average maturity of just about 5.6 years, which means duration risks are low. This fund’s annual expense ratio of just 1.64%, which is low compared to many closed end funds. This fund pays a 1.35 cent per share dividend each month and the next payment is coming up soon. The dividend is payable on February 27th to shareholders of record as of February 19, 2015. The ex-dividend date is February 17, 2015. (click to enlarge) The SPDR Barclays High Yield Bond Fund (NYSEARCA: JNK ) is a popular way for investors to buy high yield bonds. As the chart above shows, junk bonds experienced a decline in mid-December over concerns that some energy companies could be more likely to default due to the plunge in oil prices. These concerns now appear overblown and oil has recently been trending higher. A Financial Times article points out that nearly $3 billion flowed into junk bond funds during the week of February 11, 2015 and this trend could be poised to continue, as the European Central Bank’s new bond buying program is creating more demand for high yield assets. A recent Bloomberg article details why investors are pouring back into junk bond funds, and that concerns over the plunge in oil are diminishing, it states : “Junk bonds are benefiting from demand for higher-yielding assets as the European Central Bank’s new round of bond purchases pushes yields on more than $1.7 trillion of debt worldwide below zero. The resurgence is sending down borrowing costs for speculative-grade borrowers and reopening a new-issue market that all but shut at the end of the year as oil tumbled below $45 a barrel from more than $107 in June. A rebound in crude has also boosted risk appetite. “With rates getting so low, you look at high-yield and it doesn’t look so bad,” Jack Flaherty, a money manager at New York-based GAM USA Inc., which oversees $17 billion, said in a telephone interview. “That has brought investors back in after the volatility at the end of last year scared them away. The fears from weak oil, while not gone, have lessened.” For all the reasons mentioned above, it makes sense to consider this fund if you are seeking generous yields, a monthly payout that is well-covered by current earnings, and professional management. The discount of nearly 12.5% to net asset value is an added bonus because if the discount narrows back to more historical levels, investors could also be positioned for significant capital gains. Here are some key points for the Managed High Yield Plus Fund, Inc.: Current share price: $1.92 The 52 week range is $1.75 to $2.19 Annual dividend: 16 cents per share (or 1.35 cents per month), which yields about 9% Data is sourced from Yahoo Finance. No guarantees or representations are made. Hawkinvest is not a registered investment advisor and does not provide specific investment advice. The information is for informational purposes only. You should always consult a financial advisor. Disclosure: The author is long HYF. (More…) The author wrote this article themselves, and it expresses their own opinions. The author is not receiving compensation for it (other than from Seeking Alpha). The author has no business relationship with any company whose stock is mentioned in this article.

Fidelity Strategic Dividend & Income Fund Gets Results

Summary FSDIX is a multi-asset fund that has held up very well versus newer multi-asset ETFs. FSDIX aims for capital appreciation in addition to income, so yield is relatively low at 2.34 percent. FSDIX is less volatile than the competition. The Fidelity Strategic Dividend & Income Fund (MUTF: FSDIX ) was established in December 2003. The fund offers investors a multi-asset approach to income, with five major asset classes included in the portfolio. A 2.34 percent yield puts the fund’s yield not far above that of the broader market, but it comes with wider diversification and lower volatility. Manager Outlook With over two decades of experience in the financial investment industry, Joanna Bewick has served as the portfolio’s lead manager since 2008. She is assisted by co-manager Ford O’Neil who has been with Fidelity since 1990. Both of them also manage the Fidelity Strategic Income Fund (MUTF: FSICX ). The fund’s default allocations are 50 percent common stock, 15 percent convertible securities, 15 percent in REITs or other real estate-related investments, and 20 percent preferred stocks. The lead managers believe the U.S. economy will continue to improve across the majority of economic sectors. They also see the economy as being in a mid-cycle expansion, which creates an expectation of moderate corporate earnings growth. The managers believe asset classes have a fair to slightly rich valuation. Although the quantitative easing program has ended, their expectation is that any interest rate adjustments by the Federal Reserve will be gradual and data dependent. Recent low inflation numbers provide the Fed with more leeway for keeping rates low in the near term. This creates a situation where domestic bond yields are more attractive than the returns of other sovereign bonds. While they predict that dividends and income are likely to play more of a role in total returns than capital appreciation, the increased volatility may create more investment opportunities. The result is a continued bias towards dividend paying stocks, which still comprise the largest portion of the fund, due to their current income and secondary potential for capital appreciation. The fund will also maintain a normal weighting of REITs on a risk-adjusted basis as long as the macroeconomic environment remains steady. While the fundamentals of this asset class remain strong and could produce significant returns, the weighting minimizes the impact of rising interest rates that could hamper returns. Managers believe that it may be difficult to find opportunities to deploy cash in the shrinking convertible securities market, which may cause an underweighting of this asset class. They also expect to remain underweight preferred stock until valuations become more advantageous. Managers will rebalance the fund based on market conditions. Asset Allocation and Security Selection The fund seeks to provide investors with reasonable current income with the potential for capital appreciation. With an investment strategy focused on equity securities that provide current income and have the potential for capital appreciation, the no-load fund tends to concentrate on value stocks. The portfolio invests in domestic and foreign issues. When building the portfolio, lead and sub-portfolio managers evaluate securities based on the macroeconomic environment, investor sentiment and fundamentals, as well as their current and historic valuations. The team manages risks and shift allocations based on a bull-or-bear case for each asset class. Over the past quarter ending December 2014, the fund continued to favor dividend paying equities. Veteran investor Scott Offen, who has been with Fidelity since 1985, manages the common stock sleeve. His focus is on mega-cap dividend paying stocks of companies with wide economic moats, with a portfolio yield 50 percent greater than the S&P 500 and lower volatility. In addition to boasting a 3 percent yield, a strong selection of individual securities in consumer discretionary, energy and industrials helped this sub-portfolio outpace the benchmark and boost the fund’s overall returns. Adam Kramer manages the fund’s preferred stock and convertibles sleeves. Through his acumen, the fund has held up better during recent stock market declines. While the yields on preferred shares were attractive, their long durations were considered a negative factor. The resulting underweighting proved advantageous as this sector underperformed the overall market. The main drag on results was the concentration in banks, healthcare and cable TV. Another modest advantage was Kramer’s underweighting of convertible securities as this asset class also underperformed. This decision was based upon the manager’s belief that good investment opportunities were more difficult to obtain as the overall number of available issues decline. Information technology and industrial securities generated the most drag on this sub-portfolio. Minimizing exposure to these two underperforming asset classes provided a modest advantage for the overall fund. Managed by Samuel Ward, the real estate-related sleeve held a neutral weighting of REITs. This position was a contributor to the fund’s overall performance as the sector had a tremendous run. The greatest contributors were the fund’s investments in apartment and office REITs, which outperformed relative to the benchmark index. While the managers believe that fundamentals remain strong, they remain vigilant on interest rates and the possible negative impact that rising interest rates could have on the sector. Portfolio Composition and Holdings As of December 2014, this four-star Morningstar rated fund has $4.82 billion in assets under management. Compared to its goal of a neutral mix, the fund is slightly overweight common stocks and preferred stocks, while being underweight convertibles. Individual holdings are concentrated in financials, information technology, healthcare and consumer staples. The fund is underweight telecommunications and materials. While 95.84 percent of holdings are domestic securities, the portfolio has a small exposure to Europe and Asia, as well as a slight exposure to emerging markets. The market capitalization of the portfolio is 52.48 percent giant, 23.75 percent large and 16.15 percent mid cap, as well as 6.52 percent small and 1.09 percent micro cap. The fund has a P/E ratio of 18.73 and a price-to-book ratio of 2.59. The fund’s top five holdings are securities issued by Exxon Mobil (NYSE: XOM ), Chevron (NYSE: CVX ), Proctor & Gamble (NYSE: PG ), Johnson & Johnson (NYSE: JNJ ) and IBM (NYSE: IBM ). These holdings comprise 11.85 percent of the total portfolio. Roughly 9 percent of assets are in fixed income, the specialty of lead and co-managers Bewick and O’Neil. The fixed income portion of the portfolio is concentrated in debt instruments rated BBB, BB and B, with a focus on maturities between three and seven years. The fund’s average duration is 3.91 years with a 30-day yield of 2.34 percent. Historical Performance and Risk Earning a high average return rating from Morningstar, FSDIX has delivered annualized returns of 14.48 percent, 13.85 percent and 13.87 percent over the past 1, 3 and 5 years, respectively. This compares to the category averages of 8.63 percent, 11.58 percent and 11.32 percent over the same periods. FSDIX has a low risk rating from Morningstar. The fund’s three-year beta and standard deviation of 0.98 and 6.64 compare favorably to the category ratings of 1.29 and 8.45. The SPDR Dividend ETF (NYSEARCA: SDY ) has a standard deviation of 9.26, making FSDIX less volatile than plain vanilla dividend funds. Fees, Expenses and Distributions The fund does not have any 12b-1, front-end or redemption fees. The low 0.74 percent expense ratio is below the category average of 0.92 percent. FSDIX supports automatic account builder and direct deposit functions. It has a minimum initial investment of $2,500 for both taxable and non-taxable accounts. Conclusion FSDIX is a multi-asset fund that offers a yield similar to a dividend ETF, but with lower volatility. Income growth hasn’t been great given the fact that certain asset classes, such as preferred shares, do not pay rising dividends. Shares fell 41 percent in 2008, so while they are less volatile, they aren’t without risk. However, some of those losses were excessive due to fears about bank solvency during the crisis, which hit preferred shares hard. In a more typical and milder bear market, the fund should hold up better than the broader market. FSDIX fund fills a niche for investors who want slightly higher income along with their capital appreciation, plus lower volatility. Investors who want to go the ETF route can check out some of the best multi-asset ETFs . FSDIX compares favorably to these funds thanks to a heavyweight towards equities and the fact that the equity heavy Guggenheim Multi-Asset Income ETF (NYSEARCA: CVY ) was stung by exposure to energy-related holdings. (click to enlarge) Disclosure: The author has no positions in any stocks mentioned, and no plans to initiate any positions within the next 72 hours. (More…) The author wrote this article themselves, and it expresses their own opinions. The author is not receiving compensation for it (other than from Seeking Alpha). The author has no business relationship with any company whose stock is mentioned in this article.

U.S. Stocks And U.S. Bonds: What The Heck?

It is hard to believe just how many folks expect the U.S. stock market to rise substantially in the current environment. U.S. stocks and U.S. bonds are extremely overvalued. As long as one has a plan for exiting – rather than foolishly hoping-n-holding – one is able to minimize the risk of remaining invested in overvalued equities. Most people believe that Tom Cruise became an international superstar with the release of the action drama, “Top Gun” back in 1986. However, I remember the actor from an earlier film, “Risky Business.” The popular motion picture capitalized on teenage angst and harebrained ways to make money. In the film itself, the main character, Joel Goodson, turns his family home into a house of ill-repute to finance the repairs of his father’s Porsche – a car that he had been warned not to use, yet inadvertently destroyed. By the end of the movie, increasingly perilous behavior helped Joel get into Princeton, as opposed to him following a straighter-and-narrower path. Fans may recall the risk-taking tagline, “Sometimes you just gotta say, ‘What the Heck.'” In Hollywood, at least for the sake of on-screen comedy, irrational audacity may prove rewarding. In real life, however, investors tend to be compensated for taking reasonable risks. Granted, speculators can sometimes profit from bizarre decisions. Yet an investor who allows over-the-top exuberance to cloud sound judgment typically gets battered by panicky reversals of fortune. Indeed, it is hard to believe just how many folks expect the U.S. stock market to rise substantially in the current environment. Companies are not selling as much as they had anticipated as shown by rising manufacturer, wholesaler and retailer inventories. Companies in the S&P 500 are not profiting as much as executives had hoped either; analysts have been dramatically ratcheting down earnings expectations. Meanwhile, the parade of weak economic reports continue to flow in, from producer prices (excluding food and energy) registering an unexpected decline to smaller-than-expected gains in industrial production. Downward revisions to gross domestic product are a near certainty. What are the implications for the investing public? Sadly, it is a world where the two primary asset classes stateside – U.S. stocks and U.S. bonds – are extremely overvalued. And yet, the choices of how to manage the overvaluation in one’s portfolio are not particularly attractive either. Since there are no meaningful risk-free rates of return in a zero percent interest rate environment, investors have been choosing between risky and riskier alternatives. In one corner, expensive U.S. stocks may continue to appreciate on additional corporate buybacks as well as the possibility of economic acceleration. In the other corner, appallingly low-yielding U.S. bonds may produce total returns that exceed stocks due to the former’s relative value against developed world bonds; most of the developed world’s fixed-income yields are noticeably lower than comparable U.S. maturities. Of the two alternatives, I am still favoring long-term U.S. treasuries in client portfolios. The German 30-year bund yield is under 1%, while the Japanese 30-year is near 1.5%. As silly as those yields are, they are not likely to rise appreciably when the Bank of Japan (BOJ) and the European Central Bank (ECB) are in early stages of bond buying via quantitative easing exercises. Even more alarming? The 30-year yields for France, Canada and Italy are 1.45%, 2.12% and 2.61% respectively. We’re talking about fiscally irresponsible Italy having a lower yield than the U.S. at 2.71%. Does it not make sense to consider long-term U.S. bond exposure via the Vanguard Extended Duration Treasury ETF (NYSEARCA: EDV ) or the PIMCO 25+ Year Zero Coupon U.S. Treasury Index ETF (NYSEARCA: ZROZ ), especially when the 30-year yield has reverted back to a 50-day moving averages? Buying bond dips can be as rewarding as buying stock dips. The increasingly unattractive prospect of robust exposure to U.S. stocks has not kept me from sticking with the trends. My clients will continue to own funds like the iShares S&P 100 ETF (NYSEARCA: OEF ), the Health Care Select Sect SPDR ETF (NYSEARCA: XLV ), the Vanguard Mega Cap Growth ETF (NYSEARCA: MGK ) as well as the iShares MSCI USA Minimum Volatility ETF (NYSEARCA: USMV ) until there is a significant breach of the 200-day moving average on the downside. What-the-heck pricey? You bet. On the other hand, the market can remain insanely effervescent for a whole lot longer than an investor can accept 0% in a money market. As long as one has a plan for exiting – rather than foolishly hoping-n-holding – one is able to minimize the risk of remaining invested in overvalued equities. It is important to recognize, though, that stock uptrends in foreign markets come with lower P/E price-tags. Conservatively speaking, developed world stock assets trade at a 10%-15% P/E discount to the U.S., while broad-based emerging market stock assets may be trading at a 20% to 25% discount. It has been more difficult for me to embrace either the Vanguard FTSE Europe ETF (NYSEARCA: VGK ) or the Vanguard FTSE Emerging Markets ETF (NYSEARCA: VWO ) yet, as both have resistance at their respective 200-day trendlines and both do not have the currency-hedged exposure that I prefer at this moment. In contrast, I have advocated for several months on behalf of the iShares Currency Hedged MSCI Germany ETF (NYSEARCA: HEWG ) on the expectation that as the most successful exporter in the region, Germany will benefit the most from the battered euro. What’s more, HEWG’s uptrend is intact. Disclosure: Gary Gordon, MS, CFP is the president of Pacific Park Financial, Inc., a Registered Investment Adviser with the SEC. Gary Gordon, Pacific Park Financial, Inc, and/or its clients may hold positions in the ETFs, mutual funds, and/or any investment asset mentioned above. The commentary does not constitute individualized investment advice. The opinions offered herein are not personalized recommendations to buy, sell or hold securities. At times, issuers of exchange-traded products compensate Pacific Park Financial, Inc. or its subsidiaries for advertising at the ETF Expert web site. ETF Expert content is created independently of any advertising relationships.