Tag Archives: nreum

The History Of The Global Equity Portfolio

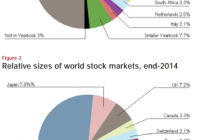
One of the nice things about thinking of the world in macro terms is that you are less inclined to fall victim to a fallacy of composition. That is, in the financial world we tend not to think in terms of aggregates so we often extrapolate personal or localized experiences into broader concepts which often results in mistakes. The most common economic fallacy of composition is thinking that if you save more then you’re better off, therefore everyone else should save more. This obviously can’t be true at the aggregate level because if everyone saved more then everyone would have less income. Likewise, in “the markets” we often think of “the market” as being something like the S&P 500 (or worse, the Dow 30) when the reality is that the “stock market” is a global market that is much broader than the S&P 500. And the financial markets are much broader than the stock markets. I got to thinking about all of this as I was going through the Credit Suisse Global Investment Returns Yearbook ( see here ). They had this fabulous chart of the dynamism of the global equity market over the last 100+ years: This chart is interesting because it shows a number of things. First, the USA was once a relatively small slice of the total market cap of outstanding stocks. Second, the reason the USA has performed so well over the last 100 years is, in large part, the result of a massive capture of market share by US corporations. This has huge implications for portfolios going forward. There is, in my opinion, a strong likelihood that the USA will lose market share to foreign firms as emerging markets become the growth engine of the world and the US economy matures and slows. So a slice of global equity market exposure not only makes sense for broad diversification, but also when considering a strategic allocation towards potentially higher growth regions. This image also shows how important it is to be dynamic and forward-looking in your portfolio to some degree. John Bogle recently made headlines for stating that a US investor shouldn’t be invested abroad. I’d be willing to bet if Bogle had been in the UK in 1899 talking about his portfolio preferences, he would have said a UK investor should stay fully invested in the UK. Why even bother investing in an emerging market like the USA? I am sure that investing in the USA back then looked fairly silly to a foreign investor. That was obviously a huge mistake. The point is, the future composition of the outstanding mix of global financial assets will change and investors who shun forecasting and some degree of necessary dynamism in their portfolios are very likely to generate returns that will be based on recency bias and extrapolative expectations (expecting the future to look like the past). One of the big lessons from history is that the future rhymes, but it rarely repeats. And a little bit of intelligent forecasting about what the future might look like could go a long way to helping your portfolio in the future. Are you Bullish or Bearish on ? Bullish Bearish Neutral Results for ( ) Thanks for sharing your thoughts. Submit & View Results Skip to results » Share this article with a colleague

Time To Worry About Utility ETFs?

Utilities – one of the best performing sectors of 2014 – started the year on a good note with smart gains logged for January. An uncertain global economic outlook, interest rate cuts in developed to emerging markets, sliding commodity prices, political instability in Greece and a surprise move by the Swiss central bank to abandon its currency cap against the euro created panic among investors driving treasury yields lower at the start of the year. However, the sector has lately given up almost all of its gains and in fact is trading in the red in the year-to-date frame. The most popular product in the space – Utilities Select Sector SPDR (NYSEARCA: XLU ) – has lost 7.4% in the past one month as against a 4% return by SPDR S&P 500 (NYSEARCA: SPY ) over the same time frame. An improved U.S. economy and a strong U.S. jobs report have sent government bond yields sharply higher in the past few weeks, making the utility sector less attractive. The U.S. economy has added more jobs than expected in January, fuelling optimism about the strength of the job market. Moreover, the U.S. average hourly earnings rose at a better-than-expected pace of 0.5% in January. The upbeat labor market data has raised optimism about the pace of economic growth, leading many to believe that a rate hike by the Fed is surely on the cards this year. Expectations of a rate hike this year has caused the 10-year Treasury bond yield to spike to a four-week high of nearly 2%, a sharp and sudden increase from levels which were in the 1.65% range earlier in the month (read: Rising Interest Rates Are Great News for These Bond ETFs ). Utilities are quite sensitive to interest rates though they offer steady and strong yields. Thus, rising Treasury yields, an improving U.S. economy and strength in the jobs market have reduced the appeal of utilities as investors are shunning defensive bets to move to sectors more closely tied to growth. Moreover, utility companies rely on a large amount of debt for conducting operational activities. Hence, any rise in interest rates would push up their borrowing costs (see 3 Sector ETFs to Profit from Rising Rates ). Given the rising yields and concerns over a hike in short-term rates this year, below we have highlighted some of the large-cap funds in this space which have been among the hardest hit by the move towards cyclical securities and away from safety. Investors who believe that this is just the beginning of the slide in the space should clearly stay away from this space. XLU is the largest and the most popular ETF in its space with an asset base of $7.8 billion and average daily trading volume of 14.7 million shares. The fund is also one of the cheapest in its space with 15 basis points as expense fees. The fund tracks the Utilities Select Sector Index, holding a basket of 30 stocks. Duke Energy (NYSE: DUK ) occupies the top spot with 9.3% allocation, followed by NextEra Energy (NYSE: NEE ) and Southern Co. (NYSE: SO ), each with a little more than 7.5% exposure. XLU has lost 4.4% in the year-to-date frame after having gained 16% in the past one year. The fund has a solid dividend yield of 3.31%. iShares Dow Jones US Utilities Sector Index Fund (NYSEARCA: IDU ) The fund too gives investors an exposure to U.S. utility stocks and manages an asset base of $1.9 billion. IDU is home to 60 stocks and is also heavily concentrated in its top 10 holdings. Duke Energy Corp. (8.3%), NextEra Energy Inc. (6.65%) and Dominion Resources Inc. (NYSE: D ) (6.3%) are the top three holdings of the fund. Sector-wise, the fund invests more than half of its assets in electric utilities, while the rest go towards multi-utilities, gas and water (see all Utilities/Infrastructure ETFs here ). The fund charges 43 basis points as fees and has a 30-day SEC yield of 2.62%. IDU has lost 7% in the year-to-date frame but up 16% in the past one year. Vanguard Utilities ETF (NYSEARCA: VPU ) VPU tracks the MSCI US Investable Market Utilities 25/50 Index to provide exposure to a basket of 78 stocks. Sector-wise, electric utilities dominate here as well, followed by a 34% allocation to multi-utilities. The fund is also quite popular in its space with an asset base of $2.1 billion and an average expense fee of 12 basis points. The fund has a 30-day SEC yield of 3.08% and has lost 7.2% in the past month.

Beyond India: Look At These Overlooked Broad Emerging Market ETFs

For the past one year, India has been dominating the broad emerging markets, thanks to the enormous ascent of its stock market on pro-growth political hopes, declining inflation – which was once a botheration for the economy – and the latest interest rate cut to spur growth. While its supremacy is still prevalent in the emerging market space, one might be concerned about the overvaluation issues associated with the Indian stocks and the related ETFs. Presently, the biggest and broader emerging market ETF – the Vanguard FTSE Emerging Markets ETF (NYSEARCA: VWO ) and the broader U.S. market SPDR S&P 500 Trust ETF (NYSEARCA: SPY ) sport a P/E (TTM) of 12 and 17 times, respectively, while iShares MSCI India Index ETF (BATS: INDA ) has a P/E (TTM) of 19 times. Secondly, a drastic slump in oil price played its role in facilitating the India ETFs’ upward journey. This was because the country imports more than 75% of its oil requirements. With global oil prices falling about 50% in the last six months, Indian foreign reserves found real reasons to cheer about. However, it remains to be seen how the Indian economy handles the situation when the oil price bottoms and reverses the trend. Also, some analysts believe that the not-so-enthusiastic December 2014 corporate results, a later-than-expected rebound in the investment cycle and overvaluation with respect to the future profit growth potential might stress out the Indian market. Given this situation, some cautious investors might begin to reconsider their emerging market investments and look for broader exposure, rather than sticking to any particular nation. After all, the emerging market space should continue to enjoy cheap money inflows, thanks to QE starting in the eurozone and the easy money policy in most developed nations, despite the likely beginning of policy tightening in the U.S. this year. In light of this, we have highlighted four overlooked ETFs that are tracking emerging markets from around the world (See all emerging market equities ETFs here ). Market Vectors MSCI Emerging Markets Quality ETF (NYSEARCA: QEM ) This fund has attracted $5.3 million in AUM. It charges a 50 bps fee per year, and trades in a paltry volume of around 1,500 shares a day, ensuring additional cost in the form of a wide bid/ask spread. The product tracks the MSCI Emerging Markets Quality Index, and holds 201 stocks in its basket (Read: QEM: A Higher Quality Emerging Market ETF? ). The ETF is slightly tilted toward the top four firms – China Mobile, Tencent Holdings, Taiwan Semiconductor and Samsung Electronics – that collectively make up for more than 20% of total assets. Other firms hold not more than 3.01% share, suggesting modest diversification across each security. The holding pattern reflects the fund’s focus on Asian countries like China (20.7%), India (13%), Taiwan (13.0%), South Korea (12%) and South Africa (11.1%), which take the top five country spots. In terms of sector holdings, Information Technology dominates the portfolio at 34%, followed by Consumer Staples (16.8%), Telecommunication Services (12.6%) and Financials (11.5%). The fund has gained 6.2% since the start of the year (as of February 13, 2015) and more than 8.5% in the last two weeks. The fund yields 2% annually (as of the same date). Behind its decent performance is quality exposure across a number of deserving sectors in the emerging markets and a focus on high-quality criteria like high return on equity, stable year-over-year earnings growth and low financial leverage. The fund trades at a P/E (TTM) of 15 times. iShares MSCI Emerging Markets EMEA Index ETF (NASDAQ: EEME ) This fund has amassed about $8.8 million in assets so far, and trades in volumes of 2,000 shares a day, resulting in additional cost in the form of a wide bid/ask spread over and above the expense ratio of 49 bps a year. The fund is tilted toward South Africa (46.2%), Russia (20.9%), while the third country, Turkey, gets a meager allocation of 9.64%. As far as sectoral diversification is concerned, Financials gets about 34% of the basket, followed by Energy (16.6%) and Consumer Discretionary (14.8%). The latest cease-fire between Ukraine and Russia and the record rally in the South African stocks led the fund way higher. The fund has gained 4.2% so far this year (as of February 13, 2015) and about 6.6% in the last two weeks. The fund yields 3.1% annually (as of February 13, 2015). It trades at a P/E (TTM) of 10 times. ALPS Emerging Sector Dividend Dogs ETF (NYSEARCA: EDOG ) The product tracks the S-Network Emerging Sector Dividend Dogs Index, which gives exposure to a basket of large-cap and high-yield stocks domiciled in the emerging markets. The index takes up an equal-weighted approach to assign weights to securities (Read: ALPS Debuts Dividend ETF in Emerging Market Space ). The index applies the “Dogs of the Dow” theory in the stock selection process. The product looks to hold about 50 stocks with this approach. The ETF offers a solid level of diversification, as both sector and country exposure is limited to five securities. Russia (11.2%), South Africa (10.4%), Brazil (10.3%), China (10%) and Thailand (9.65%) are some of the nations that the fund puts heavy weight on. EDOG has generated about $11.3 million in assets, and trades in 10,000 shares a day. It charges 60 bps in fees. The fund is up 6% in the YTD frame (as of February 13, 2015), while it yields 3.2%. The need for higher yield should be the key to the fund’s future success. EGShares Emerging Markets Domestic Demand ETF (NYSEARCA: EMDD ) EMDD seeks to tap the exponentially rising domestic demand of the emerging market space. The fund puts heavy weight on South Africa (20.2%), China (19.2%), Mexico (16%) and India (11.1%). It has an asset base of $35 million, and trades in volumes of more than 5,000 shares a day. The fund charges 85 bps in fees. Holding about 50 stocks in its portfolio, the fund does not put more than 5.37% assets in one stock. EMDD was up 5% so far this year, and has added about 3.5% in the last two weeks. The P/E (TTM) of the fund stands at 17 times.