Tag Archives: load

Low Inflation And Higher Growth Keep GLD Down
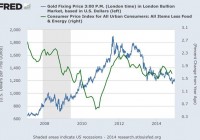
Summary The recent higher-than-expected GDP report may also suggest the rise in U.S. economy will steer investors away from gold and into other assets. The recent PCE report showed a core inflation of only 1.4%. The ongoing lower inflation is likely to keep dragging down the price of GLD. The gold market continued to show a high level of volatility in the past several weeks. Nonetheless, the SPDR Gold Trust (NYSEARCA: GLD ) is nearly flat for December and only 1.2% during 2014. But the ongoing low inflation and signs of recovery in the U.S. economy are likely to further drive down GLD over the coming months. This week didn’t offer a whole lot of news items but there were two reports that came out from the Bureau of Economic Analysis: the final update on the U.S. GDP for the third quarter and the PCE monthly update. On the one hand, the GDP growth rate was revised up again to 5%. The revision was from 3.9% back in the second estimate. Even after subtracting the change in private inventories, the growth rate remains at 5% – so the growth mostly came from private and public sectors. Part of this revision came from higher real nonresidential fixed investments that grew by 8.9%. The recovery of the U.S. economy is a step in the direction towards the FOMC raising rates next year, which is likely to bring down the price of GLD further. Another issue to consider is the progress in the U.S. inflation: The recent PCE report showed that the core PCE annual rate slipped to 1.4%. The relation between GLD and inflation concerns is a close one and may have played a major role in the progress of GLD. (click to enlarge) Source of chart is from FRED’s web site Albeit the U.S. inflation remained low in the recent year, the progress in other measures, most notably the U.S. money base, drove bullion bugs towards GLD. Even M1 showed a sharp rise. If we were to examine the change in M1 and the progress of the gold during the past few years, we can see that following the economic recession, as the growth rate in M1 picked up, so did gold rally. (click to enlarge) Source of chart is from FRED’s web site But after the end of QE2 and then QE3, the growth in M1 has tapered down, which also coincided with the drop in GLD. This doesn’t mean we are in a situation where inflation actually substantially increased. Only that the steps the FOMC implemented, including low rates and QE programs, led to higher concerns over a potential rise in inflation – all the rise in M1 and U.S. money base had some people think prices are about to pick up anytime soon (some still think so) and may reach double digits. The last time U.S. inflation reached double digits was back in the early 80’s – back then gold prices reached their highest level, for that time. This high inflation led the Fed to raise rates, which soon brought down inflation expectations – and then gold soon followed. This time around, however, the circumstances are a bit different. Some were concerned about higher inflation that led to higher GLD prices. Nevertheless, the U.S. inflation remained low. (click to enlarge) Source of chart is from FRED’s web site But the current depressed prices, which are likely to come further down considering oil is at its current low level and the FOMC’s decision to end QE3 and perhaps even raise rates by mid-2015 have only reduced the fear factor of the U.S. inflation rearing its head. Some still think that the FOMC’s cash injections to the U.S. economy may eventually result in a spike in inflation down the line – like a time-release bomb. But this scenario seems, for now, less likely. As times passes, the price of GLD is likely to further suffer from U.S. inflation remaining well below 2%. The potential rise in the Federal Reserve’s cash rate is also likely to raise the yields of U.S. treasuries, which could diminish the appeal of GLD as an investment. I have referred to this point in the past . It’s a competing theory but it too plays the same role the inflation based theory plays. So where does it leave GLD? The recovery of U.S. economy and a little growth in inflation don’t vote well for GLD. The FOMC’s policy is still likely to play the main role in the progress of GLD. This year, the tapering of QE3 didn’t have a strong adverse impact on GLD as it slipped by only 1.2% (year to date). Most of the impact was already priced in when Bernanke announced this decision back in June 2013. The main change will be the rate hike and subsequent raises. For now, the FOMC keeps dropping hints of a rate raise soon but keeps us guessing because, well, perhaps some FOMC members aren’t so sure about making this rate hike next year. Until we get a clear guidance, the price of GLD isn’t likely to do much and only slowly come down. For more see: What are the advantages of GLD?

Top Nontraditional Bond Fund Celebrates First Anniversary

The Cedar Ridge Unconstrained Credit Fund (MUTF: CRUPX ) launched on December 12, 2013, and recently celebrated its first anniversary. Ten thousand dollars invested at the fund’s inception would be worth more than $11,092 as of December 22, according to data from Morningstar. This compares very favorably to the non-traditional bond fund category average, which would have seen a $10,000 investment grow to just $10,130 over that same time. Over the past year, the Cedar Ridge Unconstrained Credit Fund’s 11.58% annualized return through December 22 ranks it at the very top of Morningstar’s Nontraditional Bond category, above 319 other funds, including all share classes. The Legg Mason BW Alternative Credit Fund (MUTF: LMANX ) is the only other fund in the category with double-digit returns over the past year, and only one of its five share-classes has that distinction. “With this Fund we have created the opportunity for us to reach a vast audience of investors who are looking for exactly what we have done; deliver superior and uncorrelated investment returns,” said Alan Hart, Cedar Ridge’s CIO and the fund’s portfolio manager, in a December 21 press release . Mr. Hart wanted to thank the fund’s investors for making it a success, but noted that the best way Cedar Ridge can thank its investors is by continuing to deliver superior performance. In addition to Mr. Hart, the Cedar Ridge Unconstrained Credit Fund benefits from the portfolio-management expertise of Jeffrey Rosenkrantz, David Falk, Guy Benstead, and Jeffrey Hudson. The fund’s objective is to provide capital appreciation and current income by employing a credit long/short strategy. As of November 30, the fund was 69% long municipal bonds, 23% long corporate bonds, 23% short U.S. Treasurys, and 11% short corporate bonds, according to its fact sheet . The Cedar Ridge Unconstrained Credit Fund’s shares are available in investor-class (CRUPX) and institutional-class (MUTF: CRUMX ) shares; with net-expense ratios of 2.18% and 1.93%, respectively. The minimum initial investment for the investor-class shares is $4,000; while the minimum for institutional-class shares is $50,000. The 11.37% one-year performance of the investor-class shares trails the 11.58% gains of the institutional shares, but still outdoes all other nontraditional bond funds, regardless of share class. For more information, view the fund’s website .

Buy Europe Without Euro Risk With This New ETF

Euro zone’s celebration of the end of a prolonged recession last year was really short-lived as the region again got itself entrapped in a slowdown and deflation worries from mid 2014. Most of the foremost nations of the continent are presently dragging their feet in terms of economic growth, with some slipping into another recession. To fight these issues, the European Central Bank (ECB) is resorting to every possible step including ultra-low policy rates, negative deposit rates and launch of a program to buy back asset-backed securities and covered bonds. If this was not enough, the ECB indicated that it would implement a broad-based QE measure should the region need it (read: Euro Zone Gets QE Hints, 3 ETFs to Buy on Stimulus Hopes ). While these measures should boost the stock market rally, a flush of liquidity is having an adverse impact on the currency, the Euro. The currency lost about 8% (as of December 12, 2014) against the greenback in the last six months. The plunge was more prevalent given the dollar’s strength during the said phase. Thanks to the Euro slide and the possibility of a strong dollar following the probable hike in interest rates next year, investors are starting to embrace currency-hedged ETFs in droves. There isn’t anything more unfortunate than seeing one’s otherwise impressive portfolio choices fail because of soft foreign currency (read: Hedged European ETFs in Focus: Best Choice for Europe Now? ). Bearing this sentiment, Deutsche Asset & Wealth Management recently rolled out a hedged version focused on Europe recently, DBEZ . Let’s discuss the fund in greater detail below: DBEZ in Detail The fund looks to follow the MSCI EMU IMI U.S. Dollar Hedged Index to provide exposure to more than 600 of the largest European companies. As of November 5, 2014, the index includes 682 securities with an average market cap ranging from about $6.09 billion to about $23.96 million. The product is highly diversified with no stock accounting for more than 2.78% of the portfolio. Among individual holdings, Bayer AG-Reg takes the top spot, followed by Total SA and Sanofi with, respectively, 2.62% and 2.56% exposure. Sector wise, Financials gets the highest exposure with 22.8% of the portfolio. Consumer Discretionary, Industrials, Materials and Consumer Staples also get double-digit investments, while Health Care gets the least exposure with only 4.8% of the basket. As far as country exposure is concerned, Germany (29.55%) gets the top priority while France (29.65%), Spain (11.57%) and Italy (7.86%) take up the next three positions. The fund charges 45 bps in fees. How Does it Fit in a Portfolio? The fund is a good choice for investors seeking exposure to the Euro zone. At the same time, it is a tool to safeguard investors from negative currency translations. Health of the Euro zone companies also appears stable as evident by impressive corporate earnings in Q3. As per Reuters , net earnings for 36% of total market capitalization reported so far are up 7.1% on almost flat revenues with beat ratios of 67% and 59%, respectively. If this was not enough, about 80% of ECB banks cleared the latest stress test. This, coupled with an accommodative central bank, undoubtedly warrants a look at the Euro zone to earn some quick gains. However, this return can be curtailed on repatriation as the U.S. dollar is hovering at multi-year highs on QE taper and rising rate risk for next year. In such a scenario, possessing DBEZ, which is protected from currency translation, in one’s portfolio might be a wise decision (read: 3 European ETFs Worth Considering on ECB Measures ). Competition The European ETF space is pretty competitive, so it could be slightly tough for the new entrant to build up assets. However, we are hopeful as the hedged ETFs space still has room to grow. The issuer itself has a product in the name of Deutsche X-trackers MSCI Europe Hedged Equity ETF (NYSEARCA: DBEU ) which offers exposure to more than 400 European stocks in developed markets while at the same time providing a hedge against any fall in a number of currencies in the region including the Euro, the British pound, and the Swiss franc to name a few. Making a debut last year, DBEU has become a $680 million fund. However, the topper among the hedged ETFs list is WisdomTree Europe Hedged Equity Index Fund (NYSEARCA: HEDJ ) which has generated about $5.2 billion in assets so far. Moreover, there is a flurry of single-country hedged ETFs in this space including ones targeting Germany, which could offer up some competition. However, investors should note that Deutsche Bank has proven its skills in offering successful hedged ETFs lately in different markets. So, the profound knowledge of the issuer on this subject might help the new entrant to garner considerable investor assets.