Tag Archives: load

There Is Great Diversification For SPHB, But It Still Carries Some Major Risks
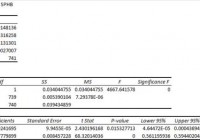
Summary I’m taking a look at SPHB as a candidate for inclusion in my ETF portfolio. The risk level makes me uncomfortable for anything over 5%. The ETF is very well diversified, just not into the kind of companies I want to hold. I’m not assessing any tax impacts. Investors should check their own situation for tax exposure. Investors should be seeking to improve their risk adjusted returns. I’m a big fan of using ETFs to achieve the risk adjusted returns relative to the portfolios that a normal investor can generate for themselves after trading costs. I’m working on building a new portfolio and I’m going to be analyzing several of the ETFs that I am considering for my personal portfolio. One of the funds that I’m considering is the PowerShares S&P 500 High Beta Portfolio (NYSEARCA: SPHB ). I’ll be performing a substantial portion of my analysis along the lines of modern portfolio theory, so my goal is to find ways to minimize costs while achieving diversification to reduce my risk level. What does SPHB do? SPHB attempts to track the total return of the S&P 500® High Beta Index. At least 90% of funds are invested in companies that are part of the index. SPHB falls under the category of “Mid-Cap Blend”. Does SPHB provide diversification benefits to a portfolio? Each investor may hold a different portfolio, but I use (NYSEARCA: SPY ) as the basis for my analysis. I believe SPY, or another large cap U.S. fund with similar properties, represents the reasonable first step for many investors designing an ETF portfolio. Therefore, I start my diversification analysis by seeing how it works with SPY. I start with an ANOVA table: (click to enlarge) The correlation is about 86%. It is low enough to provide some diversification benefits relative to holding SPY, but the benefits won’t be huge so if the standard deviation of returns is too high it may still be difficult to fit SPHB into a portfolio. Standard deviation of daily returns (dividend adjusted, measured since January 2012) The standard deviation is terrible. For SPHB it is 1.1739%. For SPY, it is 0.7300% for the same period. SPY usually beats other ETFs in this regard, but that is a very high standard deviation. Granted, it should be assumed that a high beta portfolio would have a high standard deviation of returns. Under CAPM (Capital Asset Pricing Model) the level of expected return should be easily determined by the beta of the stock. I think high beta stocks frequently more risk than they compensate for with returns. Therefore, I have a bias towards lower levels of beta. In the context of an entire portfolio, I can see the potential for benefits from using a small position in higher beta ETFs with free rebalancing to limit the amount of risk being created. Mixing it with SPY I also run comparisons on the standard deviation of daily returns for the portfolio assuming that the portfolio is combined with the S&P 500. For research, I assume daily rebalancing because it dramatically simplifies the math. With a 50/50 weighting in a portfolio holding only SPY and SPHB, the standard deviation of daily returns across the entire portfolio is 0.9359%. If we drop the position to 20% the standard deviation goes down to .8068%. In my opinion, that’s still too high. Once we drop it down to a 5% position the standard deviation is .7484%. I think 5% is about the largest position I’d consider here. Why I use standard deviation of daily returns I don’t believe historical returns have predictive power for future returns, but I do believe historical values for standard deviations of returns relative to other ETFs have some predictive power on future risks and correlations. Yield & Taxes The distribution yield is 0.88%. The ETF isn’t designed to cover the living expenses of retirees and in my opinion the risk level of the ETF combined with the low yield should encourage retirees to only consider positions even smaller than 5%. With the right level of diversification the ETF can still be used, but it isn’t built to meet those needs. I’m not a CPA or CFP, so I’m not assessing any tax impacts. If I were using SPHB, I would want it to be in a tax exempt account to remove any headaches associated with frequent rebalancing. Expense Ratio The ETF is posting .25% for an expense ratio. I want diversification, I want stability, and I don’t want to pay for them. In my opinion, a .25% expense ratio is higher than I want to pay for equity investments. It’s still low relative to many other methods of investing, but I’m looking for long term holdings and I don’t want to give my investments away. Market to NAV The ETF is at a .03% premium to NAV currently. In my opinion, that’s not worth worrying about. It is practically trading right on top of NAV. However, premiums or discounts to NAV can change very quickly so investors should check prior to putting in an order. Largest Holdings The portfolio is very well diversified. Despite my lack of interest in holding higher beta portfolios, I still appreciate the great level of diversification. The top holding is barely over 1.5% of the portfolio. That is great. Check out the chart below: (click to enlarge) Conclusion I’m currently screening a large volume of ETFs for my own portfolio. The portfolio I’m building is through Schwab, so I’m able to trade SPHB with no commissions. I have a strong preference for researching ETFs that are free to trade in my account, so most of my research will be on ETFs that fall under the “ETF OneSource” program. At this point I’m a little skeptical, but I’ll have to test the impacts of the ETF in a heavily diversified portfolio. If I do include SPHB, it will probably be a position of 5% or less. The most likely result is that I will decide to exclude SPHB from my portfolio.

5 Hedge Ideas To Protect Your Portfolio

PTT’s Yellow Alert immediately preceded the largest one-week market decline in years. PTT Research has sold most of its speculative and tertiary positions. PTT Research is keeping its Core positions. Suggestions on how and what to hedge in order to protect your portfolio. By Scott Moses Murray & Mark Gomes Recently, PTT Research Chief Analyst Mark Gomes issued a Stock Market Yellow Alert . These are fairly rare. We publish them when the market is frothy and excessively bullish or when it is showing signs of deterioration. The latter characterizes the market today. Paying subscribers received the alert on December 8th, one trading day after the S&P hit its all-time high. SPY has since fallen over 4%. Our last article discusses the conditions that prompted Mark to issue the alert. Today we will discuss ways to hedge your portfolio to protect against loss. According to the PTT Methodology , a Yellow Alert is a signal to go on the defensive. To do this, we keep the shares of official PTT picks and any other core holding we may have, but we protect ourselves by selling tertiary (non-important) holdings and putting hedges in place. To be clear, Mark does not recommend selling QAD Inc. ( QADA), Mattersight Corporation ( MATR), Glu Mobile (NASDAQ: GLUU ), JAKKS Pacific, Inc. ( JAKK), or Aero Grow International, Inc. ( AERO). He remains bullish on each of these businesses and believes their shares are undervalued, regardless of market action. In fact, he was a buyer of MATR and AERO as the market tumbled. Even during a correction, any of these companies might be acquired for a large premium over its share price today. The entire market, meanwhile, will not be acquired tomorrow for a large premium. When the market is at risk, we sell the market. We have conviction in our core positions, so we hold onto them. To protect our core positions when market risk is high, we put a full hedge in place. There are many ways to hedge. When you invest in PTT picks, you follow a strict Methodology. This is not exactly the case with hedging. It is more an art than a science. You have flexibility. It’s not so important how you hedge, but it is important that you hedge. To be fully hedged means for your hedges to have roughly the same beta-weighted value as your long positions. We won’t explain beta-weighting in depth because you can look it up easily enough, but here is a brief version. Each of your stocks has a beta, its measure of volatility relative to the indices on which it trades. If you want to fully hedge a long position, multiply its dollar value by the stock’s beta. The product of this multiplication is the dollar value you would short of the index ( IWM , QQQ etc.) to create a full beta-weighted hedge. Keep in mind that markets outside the US are also vulnerable. They make good hedges even if your stocks don’t trade there. With that in mind, here are some hedges you may want to consider. Short SPY, which tracks the S&P. If you are uncomfortable being a short-seller, buy HDGE , an ETF which shorts the market for you and goes up when the market goes down. Short EEM , which tracks emerging markets. Emerging markets typically depend on foreign investment, which flees to safety when the market looks unstable. Buy UUP , which tracks the US dollar. A beneficiary of flights to safety, the dollar tends to do well when markets fall. Short FXI , an ETF that tracks China. PTT subscribers are also shorting individual stocks that Mark’s research shows have fundamental reasons to decline regardless what the market does. A final word to the wise. This is not a Red Alert, but Mark believes conditions developing now may result in a fundamental breakdown in the market. He has issued only two Red Alerts in his career: one in 2000 and one in late 2007. A Yellow Alert is not a cause for panic. Three Yellow Alerts in 13 months imply that it is a time for caution, however. Mark plans to issue a number of market updates to PTT subscribers as events unfold, along with some picks that are Poised to Plummet-stocks that you can profit from by shorting. Visit us at www.pttresearch.com . Editor’s Note: This article covers one or more stocks trading at less than $1 per share and/or with less than a $100 million market cap. Please be aware of the risks associated with these stocks.

A Top-Ranked India ETF To Tap The Growing Consumer Sector

The Indian stock market has hardly looked back from the astounding journey it set forth on in May 2014 following the formation of the new government. Most economic factors are presently in favor of Asia’s third-largest economy, including the revival of the currency, a drastic fall in inflation thanks mainly to the oil price crash and an improvement in current account deficit. India’s wholesale price inflation – which was an acute concern leading to a series of rate hikes in the past couple of years – plunged to a five-year low in September. Though India’s Q3 GDP growth rate of 5.3% was not great, analysts from HSBC expect over 6% growth rate from this nation next year. This is noteworthy since the nation’s bourses suffered a lot last year as foreign investors remained skittish about putting more capital in the nation, leaving many questions about the potential of the country in the near term. Actually, given that India isn’t a commodity-oriented emerging market like its BRIC brothers Brazil or Russia, the nation has immensely benefited from the recent natural resource weakness. If this is not enough, Credit Suisse forecasts that Indian economy will log ‘fastest USD nominal growth in the world’ next year as noted by Reuters. To add to this, Credit Suisse believes that Indian equities are not pricey relative to the nation’s growth outlook. This recent bullish tone did spread cheers across every corner of the Indian economy as evident by at least a 25% return received from each India ETF this year. However, some specific corners need special mention. One such space is the Indian consumer sector. What Drives Consumer Sector Higher? The middle income population in India is mushrooming. This fraction of the population has an inclination to spend on discretionary items like travel and leisure which in turn boosts the sales of consumer products like automobiles and personal goods. For example, auto sales displayed a speedy annual expansion of 10% in November (yoy). Notably, auto sales are often regarded as a well-being of an economy. Lower fuel prices seemed to have done the trick. Moreover, with cooling inflation, many are speculating a rate cut in the coming days, though no such thing has taken place formally as of yet. And if in any case, the interest rate goes down, the auto industry should soar. India basically has a compelling investment proposition with its rising importance as a ‘consumer driven’ economy. As per Indian Brand Equity Foundation (IBEF), the present consumer spending will likely grow two-fold by 2025. The consumer confidence score rose to 126 in Q3 of this year from an all-time low of 92 reached in Q1 of 2010. The market is motivated by favorable demographics and expanding disposable income. IBEF also predicts that per capita income in India will likely see a meaningful CAGR of 5.4% within the span of 2010-2019 with food products and personal care taking about 65% share of the market revenue. Other forecasts by IBEF include doubling of the consumer durables market by FY15 from FY10. The young generation’s inclination toward tech-driven products will also facilitate this growth trajectory. This calls for a bullish stance over the consumer sector of the Indian economy. Here we would like to highlight the Zacks top-ranked ETF providing exposure to this very corner of the Indian market. EGShares India Consumer ETF ( INCO ) has a Zacks ETF Rank #1 (strong Buy) with a Medium risk outlook and we expect it to outperform most of its peers in the coming months meaning it could be an excellent pick for investors seeking more exposure to this economy. INCO in Focus This ETF targets the consumer industry of India and follows the Indxx India Consumer Index. It holds 30 stocks in its basket and has amassed $21.5 million in its asset base. The fund trades in a paltry volume of 15,000 shares, suggesting additional cost in the form of wide bid/ask spread beyond the expense ratio of 0.89%. The fund offers a moderately concentrated bet in the top 10 holdings as indicated by its 52% exposure to these stocks. Among individual holdings, MRF Ltd., Motherson Sumi Systems Ltd. and Bosch Ltd form the top positions of the fund with total investment of 17.7%. The fund allocates 79.42% of its asset base to consumer goods. A small proportion of the asset base has also been assigned to Industrials (15.4%) and Consumer Services (4.8%). Industry-wise, automobiles – which is presently a well-performing sector in India – accounts for 37.5% followed by personal goods (27.14%) and industrial engineering (15.4%). INCO has hit a low of $19.64 and a 52-week high of $34.89. The fund is currently hovering near its 52-week high price and could be an interesting choice in 2015 for investors seeking more Indian market exposure.