Tag Archives: load

Why Paying Up For Quality Isn’t Such A Bad Thing
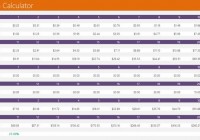
Summary As investors, our investment philosophy is closely aligned with our personality. My personality is that I like quality. Buying a basket of cheap stocks and selling them when they reach intrinsic value works. It just doesn’t work for me. Over 20 years, the stock price went from $7.50 to $260.21. That’s an annualized return of 20.52% and a cumulative return of 3370%! I’m a pretty cheap guy. But I think you have to pay up to enjoy the finer things in life. It’s nice to find great bargains. If you can buy a dollar for 50 cents, then why not? I’m a big fan of Ben Graham and the traditional value investing approach. I bought some stocks with this approach and did pretty well. However, this doesn’t exactly align with my personality. Investment Philosophy and Personality As investors, our investment philosophy is closely aligned with our personality. My personality is that I like quality. I like to buy great assets similar to how I like to collect rare video games. I know that you have to pay a little bit for quality. Sometimes you get good quality at a great price, but sometimes you get good quality at a reasonable price, which is okay too. I don’t like the idea of owning a company and hoping for the PE or book value to go up. The company is not doing so well, it’s not growing, nor creating any shareholder wealth. But it’s dirt cheap! And I hope that at some point the market will reappraise the business, it’s going to be bought out, management will do something to create value, etc. I’m a patient guy, but I don’t like the thought of depending on the kindness of others. You’re basically trying to find a higher price buyer for the same asset. A Company That Creates Wealth I like the idea of partnering with someone that’s really building a company. I’m attracted to the prospect that a company’s earnings will increase 500% over say 10 years. The fact that you made a good investment because the company has done very well is something that makes sense to me. I just have a different personality than the traditional value investor. I enjoy reading shareholder letters where management discusses the company’s many accomplishments and goals. You can read previous letters and track the progress. It’s really amazing to see a business creating wealth over time simply by reading the letters. Buying a basket of cheap stocks and selling them when they reach intrinsic value works. It just doesn’t work for me. I discovered that I like it better when I find a company I can own for 10 years and I do well not because the market does some kind of reappraisal of the business, but because the business has created wealth. But you know, that’s me. And I know the danger of paying too much for a great business so I try to be cautious on that too. With that said, let’s see how much we should pay up for quality. Time For Some Math My background is in engineering. I designed solar panels for a tech start-up a while back, thought I was going to change the world, but came up just a bit short. Coming from an engineering background, I like seeing numbers to support any valid reasoning. There’s a saying, “In the short term the stock market is a voting machine, and it’s a weighing machine long term.” I believe that’s true. It’s hard for a stock to earn a much better return that the business which underlies it earns. A lot of folks are concerned about the price they paid for an investment. The price paid for an investment starts to diminish if a company can generate an attractive return on capital (ROC) and management does a good job of capital allocation. I know I know… enough about this return on capital stuff. But I think it’s really important. You can read my previous posts about ROC here and here . Let’s say we’re going to invest in two companies and hold them for 20 years. All earnings will be reinvested back into the business every year. After 20 years, both companies will trade at 15x earnings. Okay, the first business earns 25% ROC. We paid 30x earnings on day one. In 20 years, it’ll be trading at 15x earnings, that’s a multiple contraction of 50% over time. What earnings multiple of current earnings would we need to pay for a business earning 10% ROC to end up with an identical return? 10% ROC is roughly the average for most businesses, but I might be somewhat generous there. Think about it for a minute. I was like what the f$*% when I did the calculations. I think is might be the reason why Warren Buffett likes to buy and hold forever. Here are calculations for the first business earning 30% ROC. (click to enlarge) The first business earned $0.25 on $1.00 of capital. We’re paying 30x the $0.25 in earnings, or $7.50 per share. As you can see, the impact of compounding takes effect in a big way! In the 20th year, the first business earns $17.35, or 25%, on $69.39 per share in capital. At a multiple of 15x, the stock would be trading at $260.21 per share. Over 20 years, the stock price went from $7.50 to $260.21. That’s an annualized return of 20.52% and a cumulative return of 3370%! Not too shabby… Now let’s run the numbers for the second business earning 10% ROC. (click to enlarge) The second business earned $0.10 on $1.00 of capital. Assuming the stock trades at 15x for the $0.61 earnings in the 20th year, the market would pay $9.17 for this business. On day one, we would needed to pay $0.26 per share or about 2.65x earnings to match the returns generated by the first business, which we paid 30x earnings for. The multiple needed to expand from 2.65x to 15x, which is an increase of 467%. Conclusion It looks like paying up for quality isn’t such a bad thing after all. 30x earnings might seem like a high price at first, but as you can see the returns are pretty good over the long term. It all depends on how high your hurdle rate is. Mine is 15% annually. I try to achieve this by buying truly outstanding businesses at reasonable prices. A reasonable price for me is around 15-20x earnings, lower is always better of course. Luckily there aren’t many great businesses out there, which makes tracking them somewhat easier. I think I own some fantastic businesses. And there are more great businesses I’d love to own at the right price. So I watch them here and there. I guess the take away from all this is there’s serious money to be made by holding onto a truly outstanding business year after year after year. You just have to be patient. Would you pay up for quality? Click here to download the valuation calculator. Thanks for reading!
A Pareto (80/20) Portfolio To Start The New Year

Summary Using the 80/20 principle to create an outperforming portfolio. Outperforming the market and the average investor with fewer stock holdings. Holding fewer stocks makes managing a portfolio much easier. How many stocks is it necessary to hold in a portfolio in order to minimize risk and outperform the market and the average investor? What’s your opinion? Some of the contributors on SA hold 20, 30, 40 and even more than 50 stocks in their personal portfolios. I have no reason to criticize holding that many stocks in a personal portfolio, as that’s something that is, well, personal. Nevertheless, I don’t believe it’s necessary to hold so many stocks in a portfolio in order to beat the market and most investor’s returns. In fact, I believe that any investor, by simply choosing the right stocks, could create an out-performing portfolio with as few as five to ten stocks. This is based on the Pareto, or 80/20 principle. If you’re not familiar with the Pareto principle, what it states is that 80% of the results, outputs, or rewards are generated from only 20% of the causing inputs or efforts. You can read much more about the Pareto principle and its history here. Theoretically, this means that over a specific period of time, if you were holding 30 stocks in your portfolio, only about six of those stocks would have contributed to about 80% of the returns you enjoyed. Of course, this could be back-tested, which I would love to do but don’t have the will or time for right now. Now, many investors will immediately agree that a minority of their portfolio holdings contribute to a majority of their returns during a given time frame. But, they will argue, the reason for holding a larger number of stocks in one’s portfolio is because no one can pick which stocks are going to perform the best over a given time period. Although on the surface this argument seems to make sense, I am not presently convinced that this is true. So, with that in mind, I am going to use my own real money to find out if I can pick a few stocks and still outperform the overall market and even the average investor. Following is my Pareto Portfolio holdings at the present time. Stock Shares Buy Price Price at 2014/12/24 Change Avigilon Corp. ( OTCPK:AIOCF ) 290 23.4732C 17.25C -27% Cisco (NASDAQ: CSCO ) 125 26.2695U 28.30U +7.7% Coach (NYSE: COH ) 100 35.3175U 36.97U +4.7% Dream Office Reit T.D/UN 700 25.5122C 24.76C -3% Pembina Pipelines (NYSE: PBA ) 90 39.6206C 41.58C +5% Following are brief overviews of each company. Avigilon Corporation was founded in 2004. The company designs and manufactures high-definition video surveillance solutions. The company’s systems protect and monitor various locations worldwide and their customers include major corporations, government institutions, stadiums, retail environments, casinos, transportation stations, and more. Financial Highlights: 2008 to 2013 CAGR of 102% FY14 first nine months revenues of 191.9 million FY14 first nine months adjusted EBITDA and net income of 35.3 million and 22.2 million respectively FY14 projected revenues of 280 million projected revenues of 500 million by end of FY2016 the company does not pay a dividend Analysts Recommendations Recommendation Trends This Month Previous Month Strong Buy 1 1 Buy 8 9 Hold 0 0 Underperform 0 0 Sell 0 0 Cisco Systems was founded in 1984. The company designs, manufactures, and sells Internet Protocol (IP) based networking products and services related to the communications and information technology industry worldwide. It provides switching products and storage products, as well as offering service provider video infrastructure and collaboration products. Further, the company offers wireless products and provides technical support services and advanced services. The company serves businesses of various sizes, public institutions, telecommunications companies, other service providers, and individuals. Financial Highlights (Source: Valuentum ) 3-year historical Revenue CAGR of 2.9% and 5-year projected of 3.4%. 3-year historical EBITDA CAGR of 3.6% and 5-year projected of 7.4%. 3-year historical Net Income CAGR of 6.6% and 5-year projected of 8.6%. 3-year historical ROIC (without goodwill) is 56.4%, giving Cisco a ValueCreation rating of EXCELLENT . current Dividend Yield of 2.69% Analyst Recommendations Recommendation Trends Current Month Previous Month Strong Buy 10 9 Buy 16 16 Hold 11 11 Underperform 4 5 Sell 1 1 Coach was founded in 1941. The company provides luxury accessories and lifestyle collections for women and men in the U.S. and internationally. The company markets its products through a network of company-operated stores, including Internet in North America, and Coach-operated stores in and concession shop-in-shops in Japan, Mainland China, Hong Kong, Macau, Singapore, Malaysia, South Korea, the United Kingdom, France, Ireland, Spain, Portugal, Germany, and Italy. It also sells its products to wholesale customers and distributors in approximately 35 countries. Financial Highlights (Source: Valuentum) 3-year historical Revenue CAGR 4.9% of and 5-year projected of 2.9% 3-year historical EBITDA CAGR of (3.6%) and 5-year projected of 5.3% 3-year historical Net Income CAGR of (3.9%) and 5-year projected of 5.6% 3-year historical ROIC (without goodwill) of 106.7% giving Coach a ValueCreation rating of EXCELLENT. current Dividend Yield of 3.65% Analyst Recommendations Recommendation Trends This Month Previous Month Strong Buy 2 2 Buy 4 5 Hold 21 18 Underperform 4 4 Sell 1 1 Dream Office REIT (TSX:D.UN) Dream Office REIT is an unincorporated, open-ended real estate investment trust. The firm owns a portfolio of high-quality, well-located and attractively-priced business premises. The company’s portfolio comprises central business district and suburban office properties totaling approximately 24.7 million square feet of gross leasable area in major urban centers across Canada. Financial Highlights ttm Revenues of 757.26 million ttm EBITDA of 428.15 million ttm Diluted Earnings/Share of 1.95 Book Value per share of $35.27 ttm Dividend Yield of 9.05% Analyst Recommendations Ford Equity Research Buy N/A TD Securities Buy $31.00 price target CIBC World Markets Sector Perform $31.00 price target National Bank Sector Perform $31.00 price target Scotia Capital Sector Perform $31.75 price target RBC Capital Sector Perform $30.00 price target Pembina Pipeline Corporation Pembina Pipeline Corporation was founded in 1997. The company provides transportation and midstream services for the energy industry in North America. It operates through four segments: Conventional Pipelines, Oil Sands and Heavy Oil, Gas Services, and Midstream. The Conventional Pipelines segment operates 8,200 kilometers pipeline network and related facilities that transport crude oil, natural gas liquids, and conventional oil and condensate in Alberta and British Columbia. The Oil Sands and Heavy Oil segment owns and operates Syncrude, Horizon, Nipisi, and Mitsue Pipelines, as well as the Cheecham Lateral, which transports synthetic crude oil to oil sands producers. This segment operates approximately 1,650 kilometers of pipeline. The Gas Services segment operates natural gas gathering and processing facilities, including 4 gas plants and 12 compressor stations, as well as operates gathering pipelines. The Midstream segment has interests in extraction and fractionation facilities; and provides terminalling and storage hub services. Financial Highlights ttm Revenues of 5.34 billion ttm EBITDA of 879.06 million ttm Net Income of 319.82 million ttm Diluted Earnings/share of $1.00 ttm Dividend Yield of 4.30% Analyst Recommendations Company Recommendation 12-month Price Target RBC Capital Outperform $51.00 TD Securities Buy $57.00 National Bank Outperform $55.00 CIBC World Markets Outperform $55.00 Scotia Capital Outperform $52.00 Haywood Securities Buy $57.00 There is only one rule I will follow regarding this portfolio. At no time can I exceed holding 10 stocks at one time. Other than that, I can add to any of the current positions at any time, I can add new positions at any time and I can sell any portion of or all of a position at any time. The point is to see how well this portfolio will perform in 2015 against the overall market. I will immediately update my readers of any additions to or changes I make to the portfolio. I’ll also do a complete update of the portfolio’s progress at the end of each month. I’m very interested in seeing how this Pareto Portfolio is going to do and I’ve love to hear your comments, ideas, feedback too. Additional disclosure: I am also long on the Dream Office REIT, symbol D.UN on the TSX.

KBWY: Small-Cap REIT ETF Has Attractive Yield

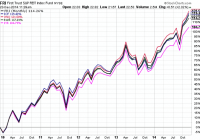
Summary FRI offers similar exposure to VNQ, but at five times the cost. Small-cap KBWY delivers a full percentage point more in yield. KBWY has outperformed large-cap REITs when interest rates increased in the past. There are two more ETFs to cover on the domestic side. The first is the First Trust S&P REIT Index ETF (NYSEARCA: FRI ). This one of the smaller REIT ETFs on the market, but has amassed nearly $300 million since inception in 2007. Index & Strategy FRI tracks the S&P United States REIT Index. The index covers U.S. REIT shares, including some specialty REITs such as prisons, but holds no timber REITs. Due to criteria that the companies own properties, the index also excludes mortgage REITs. The holdings are weighted by market cap. The holdings and the weightings in FRI are most similar to those of the Vanguard REIT Index ETF (NYSEARCA: VNQ ), which tracks the MSCI US REIT Index. Performance FRI has slightly trailed other pure real estate REIT ETFs over the past five years. (click to enlarge) The fund most similar to FRI is VNQ. Since FRI costs 0.40 percent more to hold, it has consistently underperformed VNQ. The line is almost perfectly straight, reflecting the extremely tight correlation between the funds. (The dip at the end of the chart is due to FRI going ex-dividend today.) (click to enlarge) Expenses FRI charges 0.50 percent versus the 0.10 percent charged by VNQ. Income FRI has a 30-day SEC yield of 3.23 percent. The yield is solid, but its payouts have been more erratic than VNQ (data from Yahoo Finance). (click to enlarge) Conclusion Investors should stick with Vanguard REIT Index ETF, which delivers almost exactly the same exposure, but at a lower cost and steadier income stream. A more attractive REIT ETF is an offering from PowerShares with a portfolio heavily tilted towards small-caps, the PowerShares KBW Premium Yield Equity REIT Portfolio ETF (NYSEARCA: KBWY ). Index & Strategy KBWY tracks the KBW Premium Yield Equity REIT Index, which is “a dividend yield weighted methodology that seeks to reflect the performance of approximately 24 to 40 small- and mid-cap equity REITs in the United States.” The portfolio is currently about 75 percent invested in small-caps, 22 percent in mid caps and 3 percent in large-caps. The portfolio is diversified, but has only 31 holdings. The largest holding, Government Properties Income Trust (NYSE: GOV ), has 5.14 percent of assets, and the smallest holding, STAG Industrial (NYSE: STAG ), has 1.20 percent. Similar to other REIT ETFs, retail makes up the largest slice of assets at about 27 percent, but healthcare is close behind, with nearly 26 percent of assets as of September 30. Diversified REITs make up 20 percent of assets, followed by 14 percent of assets in office REITs. Performance KBWY has kept pace with other REIT ETFs over the past five years, but trailed from 2011 through 2012. (click to enlarge) KBWY has shown some sensitivity to rates, but it has generally under performed as rates decreased, as shown in this comparison with VNQ. The 10-year Treasury yield is in black. (click to enlarge) Expenses KBWY charges 0.35 percent. It is a relatively low expense ratio adjusting for the fact that the portfolio is in small-caps. Income KBWY has a 30-day SEC yield of 4.74 percent, making it the highest-yielding non-mortgage REIT ETF we’ve covered. KBWY pays monthly dividends. Payouts have been consistent from month to month, and have been generally rising since the end of 2011. Conclusion KBWY has been a consistent performer. It has been more volatile than REIT ETFs which fall in the large-cap category, but its performance hasn’t deviated widely from the pack. KBWY has a three-year standard deviation of 14.64 versus VNQ’s 13.42 standard deviation. The big difference so far has been that more of KBWY’s return comes in the form of income. Investors interested in higher income or monthly payouts can pair KBWY with a fund such as VNQ to up the total payout from their REIT exposure. It remains to be seen if KBWY can outperform when interest rates increase. If it can, it would make the fund a compelling option in a rising rate environment.