Tag Archives: load

Buy Energy CEFs With Large Distributions And Steep Discounts To Play An Oil Rebound

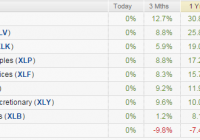
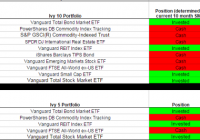
Summary Energy was the worst performing sector in 2014. Year end tax loss harvesting driven both energy stocks and CEFs lower setting up a potential for a strong rebound. Funds are available with distributions as high as 12.16% and discounts as wide as 14.85%. Overview: After a strong start to 2014, energy stocks slid in the second half driving energy to be the worst performing sector of the year. Source: Seeking Alpha 1/1/2015 Oil prices have suffered due to the stronger dollar and OPEC’s decision not to cut oil production. The iPath S&P GSCI Crude Oil ETN (NYSEARCA: OIL ), which follows the price of west Texas intermediate crude oil, fell 51% from a high of $25.96 on June 20, 2014 to close the year at $12.54. This large fall in oil prices put significant pressure on energy stocks. There is much debate about what energy prices will do in 2015. Geopolitical risk doesn’t seem to be decreasing and could drive large spikes in oil prices if issues in the Middle East or Russia flare up during the year. On the other side, U.S. energy companies are only now starting to cut capital budgets. U.S. production levels are still expected to be higher in 2015 than in 2014. U.S. production growth combined with stable output from OPEC nations could continue to pressure oil prices. Another variable will be global economic growth. The United States has seen economic growth strengthen, while Europe continues and China’s growth rate has continued to slow. If the global economy is able to strengthen in 2015 it would support oil prices. Energy stock’s move lower has improved the energy sector’s attractiveness relative to the S&P 500. Using the Energy Select Sector SPDR (NYSEARCA: XLE ) to represent energy stocks, we see that energy offers a higher dividend yield with lower price to earnings and price to book ratios than the SPDR S&P 500 Trust ETF (NYSEARCA: SPY ). However, forward growth expectations for the energy sector are lower than the S&P 500. 5 year forward growth expectations for energy have fallen from 12.73% in September to 10.21% now as analysts have cut their expectations due to lower oil prices. Source: State Street Global Advisors 1/1/2015 The move lower in energy stocks also impacted closed end funds investing in energy. The funds offer attractive yields and continue to trade at wide discounts to underlying net asset values. Investors looking to add to energy holdings in 2015 would be wise to look at CEFs as a way to buy $1.00 of assets for $.90 or less. Investors could also see an added boost as year end tax loss harvesting has affected both the closed end funds and the underlying securities. This could set up an interesting rebound if oil can stabilize. Closed end funds also offer attractive distributions. Some of the funds use options strategies to decrease risk increase distributions. Energy stocks remain attractive long term and offer one of the better values in a stock market hitting all time highs. Energy is also an attractive investment as most investors are naturally hedged. Energy is used to fuel their car or heat their homes. If energy prices fall, energy consumption costs will move lower, helping to offset losses in their investment portfolio. If energy prices rise, investors should see better performance in their investment portfolio to help cushion the increased cost at the pump. Gasoline prices have fallen along with oil and now could be an attractive point to increase this hedge in investors portfolios. The graphic below lists several metrics that can help quickly evaluate closed-end funds including distribution, leverage, premium/discount, 1 Year Z-Statistic (from Morningstar), historic returns, and fund expense ratios. Data for XLE and the iShares Global Energy ETF (NYSEARCA: IXC ) are also included to provide ETF options for investing in the same space. Data for the SPY is included to offer information for the broader market. The ETF results can also be used as a benchmark to evaluate performance. (click to enlarge) Source: Morningstar 1/1/2015 All of the energy CEFs showed negative performance for the last three months. There was a wide range of performance from the Voya Natural Resources Equity Income Fund (NYSE: IRR ) posting the best return of -14.18% to Tortoise Energy Independence (NYSE: NDP ) posting a -21.58% NAV return. CEF discounts have remained pretty close to their levels at the end of Q3. The most notable exception was BlackRock Energy & Resources (NYSE: BGR ) which saw its discount narrow to 5.67% from 10.75%. The relatively poor performance from BGR in 2014 is a little surprising. The fund is unlevered and uses an options strategy to produce extra income and reduce risk. BGR has a strong management team that has produced relatively attractive returns over longer periods particularly compared to IXC. IXC is probably the more appropriate benchmark due to the fund’s large exposure to international integrated oil names. BGR’s discount narrowed in the fourth quarter. The narrow current discount reduces the attractiveness of BGR at current prices compared to some of the other CEFs. An in depth profile of BGR is available here . The Cushing Renaissance Fund (NYSE: SZC ) had the strongest performance of energy CEFs during 2014. However, SZC had a difficult fourth quarter. The fund takes a little different approach to energy investing. SZC is focused on companies poised to benefit from increased domestic oil production. The fund invests in both the energy companies working to boost their production, as well as industrial companies that are expected to benefit from lower energy and feedstock costs. This is a broader way to invest in companies poised to benefit from the North American shale revolution. The fund saw a significant slide in the fourth quarter as lower global energy prices reduced the competitive advantage of lower US energy prices. SZC’s price is likely to show the largest reaction of the group to the global economy. The fund could provide some protection against lower energy prices, as it invests in companies that would benefit from the lower prices in addition to E&P companies. The fund saw the discount widen during the forth quarter. The current discount of 12.85 is below the fund’s 1 year average and could offer an opportunity. The widening discount in the fourth quarter also points to some tax loss selling in the fund, which could drive a rebound early in 2015. An in depth profile of SZC is available here . The Petroleum & Resources Corporation (NYSE: PEO ) has been around since 1929 and is the oldest and probably the best known closed end fund in the group. The fund offers the lowest expense ratio in the group. PEO has shown strong longer term performance and provided more downside protection than its peers 2014. The current 13.50% discount to NAV combined with the 7.93% distribution (mostly made up of capital gains) makes this fund an attractive potential addition at current levels. The Tortoise Energy Independence Fund was the worst performing CEF during the fourth quarter. NDP’s focus on North American exploration and production companies investing in shale resources hurt. Shale focused companies were some of the worst performers in the fourth quarter. NDP has a relatively aggressive portfolio due to its focus on shale E&P companies. The fund has the widest discount to NAV in the group at 14.85% and offers an attractive distribution of 9.23%. The fund employs leverage but the ratio appears manageable. The focus on shale E&P companies could make this fund one of the more volatile energy CEFs. Investors looking for a fund with leverage to increasing oil prices should consider this fund. Like BGR, the VOYA Natural Resources Equity Income Fund uses an options strategy. However, IRR’s NAV performance has not impressed during the fund’s life. IRR does has the highest distribution in the group at 12.16%. IRR’s discount widened a bit in the fourth quarter but remains above its one year average. The moderate discount and poor long term performance track record reduces the attractiveness of this fund. Conclusion: Oil prices accelerated their slide in the fourth quarter. The slide in oil prices hurt energy stocks which ended the year as the worst performing sector. Energy stocks could rebound if the global economy picks back up or if the dollar stops its advance. Individual investors may look to add energy sector exposure to hedge their energy use. Energy CEFs with attractive discounts and high distributions are worth consideration for investors looking to add energy exposure. PEO has a long track record with solid performance. The 7.93% distribution and 13.50% discount looks attractive. SZC also looks attractive. It is a broader offering will benefit from domestic energy production and a global economic recovery. NDP is probably the riskiest of the group due to its focus on shale exploration and production companies. If investors are looking for a beta trade NDP’s 14.85% discount and -1.24 Z-score look attractive. The fund is unproven, but invests specifically in companies benefiting from energy production growth in North America. If oil prices rebound NDP could see the most benefit.

Ivy Portfolio Year End Update

Scott’s Investments provides a daily Ivy Portfolio spreadsheet to track the 10-month moving average signals for two portfolios listed in Mebane Faber’s book The Ivy Portfolio : How to Invest Like the Top Endowments and Avoid Bear Markets. Faber discusses 5, 10, and 20 security portfolios that have trading signals based on long-term moving averages. I have replaced the Google Docs Ivy and Commission Free portfolio with a new spreadsheet. Please update any bookmarks or links to the newest spreadsheets found here . The Ivy Portfolio spreadsheet tracks the 5 and 10 ETF Portfolios listed in Faber’s book. When a security is trading below its 10-month simple moving average, the position is listed as “Cash.” When the security is trading above its 10-month simple moving average the position is listed as “Invested.” The spreadsheet’s signals update once daily (typically in the late evening) using dividend/split adjusted closing price from Yahoo Finance. The 10-month simple moving average is based on the most recent 10 months including the current month’s most recent daily closing price. Even though the signals update daily, it is not an endorsement to check signals daily or trade based on daily updates. It simply gives the spreadsheet more versatility for users to check at his or her leisure. The page also displays the percentage each ETF within the Ivy 10 and Ivy 5 Portfolio is above or below the current 10-month simple moving average, using both adjusted and unadjusted data. If an ETF has paid a dividend or split within the past 10 months, then when comparing the adjusted/unadjusted data you will see differences in the percent an ETF is above/below the 10-month SMA. This could also potentially impact whether an ETF is above or below its 10-month SMA. Regardless of whether you prefer the adjusted or unadjusted data, it is important to remain consistent in your approach. My preference is to use adjusted data when evaluating signals. The current signals based on December’s adjusted closing prices are below. The spreadsheet also provides quarterly, half year, and yearly return data courtesy of Finviz . However, this data is not currently importing properly so is not included in the screenshot below: (click to enlarge) I also provide a “Commission-Free” Ivy Portfolio spreadsheet as an added bonus. This document tracks the 10-month moving averages for four different portfolios designed for TD Ameritrade, Fidelity, Charles Schwab, and Vanguard commission-free ETF offers. Not all ETFs in each portfolio are commission free, as each broker limits the selection of commission-free ETFs and viable ETFs may not exist in each asset class. Other restrictions and limitations may apply depending on each broker. Below are the 10-month moving average signals (using adjusted price data) for the commission-free portfolios: (click to enlarge) (click to enlarge) Many of you have asked for return data of the Ivy strategy. Below is data for a 10-month moving average system using the Ivy 10 and Ivy 5 portfolio tracked on my site. The test was conducted using ETFReplay.com, so while signals should match mine the returns listed below are strictly hypothetical. The backtest will invest in the chosen ETFs on the close of the LAST DAY of the period. The test was run 2010-2014 and returns have been underwhelming compared to a traditional balanced mutual fund: Ivy 10 (click to enlarge) Ivy 5 (click to enlarge) Disclosure: None

Time For An Overseas Shopping Trip?

Summary US markets have performed better than any other major market in the last 5 years. Value investors are casting their gaze over international equities. However, it is important to be cognizant of the risks involved in shopping overseas. After 3 years of strong returns for the S&P 500 many value investors are casting their gaze over international markets, where gains have been more modest and valuations look more reasonable. The gain in the dollar versus other currencies has made the divergence even starker, as the chart here shows: (click to enlarge) Source: StockViews Research European markets look attractive due to cheaper valuations, while Asian markets offer some exciting growth opportunities. However, investing in international markets, particularly emerging ones, can be fraught with danger and there are a number of issues that require careful consideration. There was a time in the 1990s when investing in emerging markets was practically a sackable offence in the fund management industry. EM investing is much more in vogue now, although a healthy dose of skepticism is just as necessary. Attitude to Shareholders We often take it for granted that management will maximize value for shareholders over all else. Sometimes they focus excessively on the short-term and sometimes management gets power hungry, but the abuse of power is kept in check by strong corporate governance and pressure from shareholders. A culture of “working for shareholders” doesn’t always exist in other parts of the world. Management tends to be more entrenched, and will often prioritize their own personal ambition over the company. Shareholder activism is simply not a feature of most markets and corporate governance may be weaker. Often management will know to “make the right noises” to shareholders, but the reality does not always match up with the rhetoric. Sometimes they don’t even bother to hide their true intentions. At one meeting I had with an Eastern European bank CFO, when I asked about strategy he thumped his fist on the desk as he said “We aim to be…BIG”. Particular issues exist where a company is still part-owned by the state or is dominated by a founding family. In these cases, management may view the company with a very different perspective to shareholders – as an extension of state power or as a local employment provider. Wendelin Wiedeking, CEO of Porsche ( OTCPK:POAHY ), said in an interview: “Yes, of course we have heard of shareholder value. But that does not change the fact that we put customers first, then workers, then business partners, suppliers and dealers, and then shareholders” In some cases the longer-term focus of a family-run company can be an advantage. Most of the time, after all, the interests of multiple stakeholders are aligned. However the investor needs to get into these situations with eyes open and an understanding of management attitude – too often shareholders “cry foul” after the event, when they should have known better from the start. Disclosure of Information Equity markets are more mature in the US than other parts of the world. Over the past 100 years, disclosure has improved and adherence to US GAAP is strong. Companies often go beyond the minimum requirements and public information is freely available on the web. Elsewhere this culture is not so ingrained. There may be little disclosure beyond the statutory minimum and little effort to explain the key drivers. An industrial analyst I knew was once visiting Russia and asked the management why information was so lacking on the company, an unsatisfactory situation given his firm now owned 1% of the share base. When pressed, the CEO answered ” You have 1% of shares, I give you 1% of the information! ” State Interference For most industries in the US, it is accepted that the profits of a company belong to its shareholders. You can reasonably expect that a company will go about its business without (excessive) interference from the state. Unfortunately elsewhere many companies are subject to capricious tax regimes and even confiscation. These risks are not always obvious, since it is not a problem until it becomes one. State interference is particularly a danger where a company relies on physical assets that cannot be moved overseas (such as a mining or oil company), or when a company operates in a highly-regulated industry. In other cases (particularly in construction) a company may rely heavily on contracts from the state. Some companies, like Gazprom ( OTCQX:GZPFY ) in Russia, are so intertwined with the state it is not clear exactly what you are buying when you become a shareholder. Liquidity The US markets are the deepest and most liquid equity markets in the world. Many investors assume it is the same when they invest in foreign equities. While volumes may look strong in an up market, this can change quite rapidly into a down cycle. Combined with movements in the currency, this often leads to quite sharp declines in the stock price. Of course, the long-term investor can turn this to an advantage since a liquidity crunch can create some great buying opportunities (though patience may be required). Returns versus Growth Many investors are attracted to emerging markets by the prospect of growth. However it’s a rookie mistake to equate GDP growth with growth in the stock market. Despite 7-8% GDP growth in China over the last five years, the Shanghai Composite is the worst performing index of our five indices over five years. Some companies that are not attuned to shareholder value may chase growth regardless of returns. When a company tries to grow rapidly without addressing return on capital, this destroys value (see this StockViews Campus Video for an explanation). Investors should always be alert for these kind of situations and not be seduced by a simple promise of “higher growth”. Conclusion Of course all the risk factors listed here are generalizations. There are plenty of outstanding international companies with a deep sense of responsibility to shareholders who are pro-active about disclosure. Even where these risks do exist, you should do what you would with any investment – seek to understand the risk and factor it into what you’re prepared to pay. You will be following in the footsteps of a number of seasoned investors who have made such investments in recent years, including Buffett [POSCO (NYSE: PKX )], Peltz [Danone ( OTCQX:DANOY )] and Einhorn (Greek Banks).