Scalper1 News
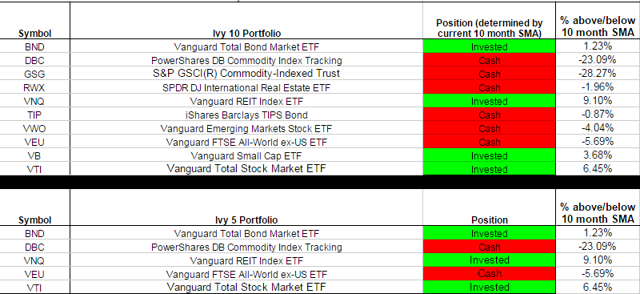
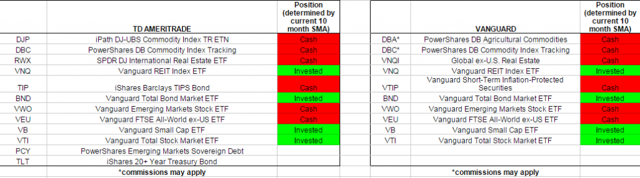
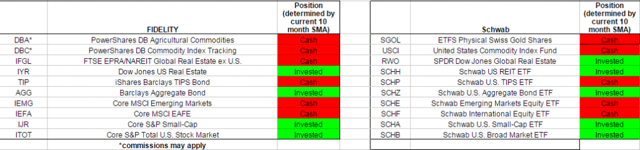
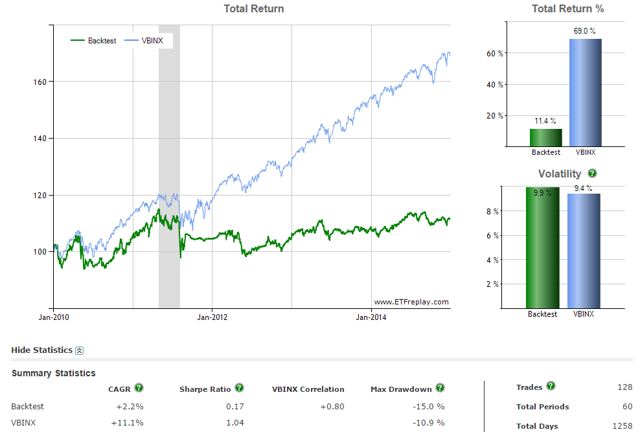
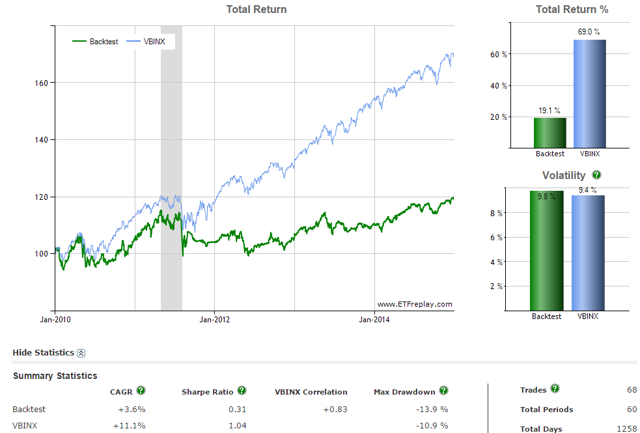 Scott’s Investments provides a daily Ivy Portfolio spreadsheet to track the 10-month moving average signals for two portfolios listed in Mebane Faber’s book The Ivy Portfolio : How to Invest Like the Top Endowments and Avoid Bear Markets. Faber discusses 5, 10, and 20 security portfolios that have trading signals based on long-term moving averages. I have replaced the Google Docs Ivy and Commission Free portfolio with a new spreadsheet. Please update any bookmarks or links to the newest spreadsheets found here . The Ivy Portfolio spreadsheet tracks the 5 and 10 ETF Portfolios listed in Faber’s book. When a security is trading below its 10-month simple moving average, the position is listed as “Cash.” When the security is trading above its 10-month simple moving average the position is listed as “Invested.” The spreadsheet’s signals update once daily (typically in the late evening) using dividend/split adjusted closing price from Yahoo Finance. The 10-month simple moving average is based on the most recent 10 months including the current month’s most recent daily closing price. Even though the signals update daily, it is not an endorsement to check signals daily or trade based on daily updates. It simply gives the spreadsheet more versatility for users to check at his or her leisure. The page also displays the percentage each ETF within the Ivy 10 and Ivy 5 Portfolio is above or below the current 10-month simple moving average, using both adjusted and unadjusted data. If an ETF has paid a dividend or split within the past 10 months, then when comparing the adjusted/unadjusted data you will see differences in the percent an ETF is above/below the 10-month SMA. This could also potentially impact whether an ETF is above or below its 10-month SMA. Regardless of whether you prefer the adjusted or unadjusted data, it is important to remain consistent in your approach. My preference is to use adjusted data when evaluating signals. The current signals based on December’s adjusted closing prices are below. The spreadsheet also provides quarterly, half year, and yearly return data courtesy of Finviz . However, this data is not currently importing properly so is not included in the screenshot below: (click to enlarge) I also provide a “Commission-Free” Ivy Portfolio spreadsheet as an added bonus. This document tracks the 10-month moving averages for four different portfolios designed for TD Ameritrade, Fidelity, Charles Schwab, and Vanguard commission-free ETF offers. Not all ETFs in each portfolio are commission free, as each broker limits the selection of commission-free ETFs and viable ETFs may not exist in each asset class. Other restrictions and limitations may apply depending on each broker. Below are the 10-month moving average signals (using adjusted price data) for the commission-free portfolios: (click to enlarge) (click to enlarge) Many of you have asked for return data of the Ivy strategy. Below is data for a 10-month moving average system using the Ivy 10 and Ivy 5 portfolio tracked on my site. The test was conducted using ETFReplay.com, so while signals should match mine the returns listed below are strictly hypothetical. The backtest will invest in the chosen ETFs on the close of the LAST DAY of the period. The test was run 2010-2014 and returns have been underwhelming compared to a traditional balanced mutual fund: Ivy 10 (click to enlarge) Ivy 5 (click to enlarge) Disclosure: None Scalper1 News
Scalper1 News