Tag Archives: load

Why Exelon Corporation Will Outperform The Market In 2015

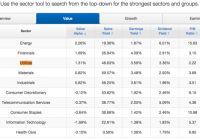
The strong rally in utilities will continue into 2015, despite statements to the contrary from analysts, as the sector is still strongly undervalued relative to the market. Exelon combines an attractive valuation with strong price momentum and EPS growth. We expect the stock to outperform the market by 8.7% over the next 12 months. Entergy Corporation, Hawaiian Electric, and Westar Energy are other electric utilities that look poised to outperform the market in 2015. A) Introduction The Utilities sector surprised many by posting the best price performance in the market in 2014. Electric utility companies were a particularly strong subset of the sector, posting an average gain of 31% during the course of the year. At this point, many investors are questioning whether the current rally will continue, especially with rising interest rates on the horizon (high interest rates hurt utilities). On Wednesday, Michael Purves, the head of equity derivatives research at Weeden & Co, advised investors to “start to take profits given the run is getting long in the teeth.” Contrary to common sentiment, we feel the sector’s momentum and growth should serve a signal of further outperformance, as the sector is still strongly undervalued relative to the overall market. Investors unfamiliar to our style of analysis should know that we solely look at metrics that have a long historical track record of predicting stock returns. We’ll first analyze how the overall Utility sector stacks up to the other nine sectors in ten metrics that have been academically shown to predict returns. Then, we’ll look into which stocks within the Electrical Utility industry group look poised to lead the group, again looking at value, momentum, and earnings. B) Top-Down Analysis of the Utility Sector In deciding whether to invest in certain utility stocks, it is critical to first look at how the overall sector stacks up relative to other sectors in value, momentum, and growth. The table below shows how the sector compares to other sectors in five valuation metrics that have been academically proven to predict returns: (click to enlarge) Source: QuantifiedAlpha.com The utilities sector looks the most attractive of any of the sectors on a book value basis, with the sector’s average price/book ratio of 2.22 being the lowest of any of the sectors. The sector looks relatively attractive on both a revenue and earnings basis, with a sales yield of 49% and earnings yield of 3.6%. Even with the big rally, the average utility stock pays a 3.4% dividend, good for third behind the Energy and Telecom sectors. Undervalued stocks tend to outperform the market, and using the average amount of excess return generated by these factors historically, our algorithms estimate how much. Overall, we expect the average utility stock to generate 1.31% of alpha attributable to value, over the next twelve months. Next, we analyze how the sector is doing on a growth & momentum basis: (click to enlarge) Source: QuantifiedAlpha.com As we said before, the utility sector has performed the best over the last twelve months, gaining 25% on average. It is the second best performing sector over the last six months, behind the Health Care sector, gaining a shade under 9%. The sector falls in the middle of the pack in average annual EPS growth, growing 18%. The sector is also in the middle of the pack in financial efficiency, returning an average of 2.8% on assets and 9.8% on equity. Each of these five metrics has been academically shown to predict stock returns, with the two price momentum metrics being the most important. Overall, we expect the average utility stock to generate 1.33% of alpha attributable to growth over the upcoming twelve months. C) Group Leaders Now that we’ve analyzed the sector on a top-down basis, we’ll now look at which stocks within the electric utility industry group look poised to lead the group. Below is a table showing which stocks in the group are the most undervalued: (click to enlarge) Source: QuantifiedAlpha.com As we can see, our top five most undervalued electrical utilities include Entergy Corporation (NYSE: ETR ), Exelon Corporation (NYSE: EXC ), Portland General Electric Company (NYSE: POR ), American Electric Power Co. (NYSE: AEP ), and Westar Energy (NYSE: WR ). Each of these companies has a sales yield (inverse of Price/Sales) over 45%, which is way above the overall market average. Each of these stocks sport similar earnings and dividend yields, each of which are again much higher than the overall market averages. These stocks also look attractive on a book value basis, with none of the company’s having a price/book ratio over 2. Overall, Entergy tops out as the value leader of the group, with our algorithms expecting the stock to generate 5.8% of value alpha over the next twelve months. With that being said, each of the five stocks is expected to significantly outperform the market due to their attractive value. Next, we’ll see which stocks are leading the sector in growth and momentum: (click to enlarge) Source: QuantifiedAlpha.com As we can see, our top five strongest growth electrical utilities include ITC Holdings Corp. (NYSE: ITC ), Hawaiian Electric Industries (NYSE: HE ), MGE Energy (NASDAQ: MGEE ), Northeast Utilities (NYSE: NU ), and Exelon Corporation. After a slow start to the year, Hawaiian has had a very strong second half of the year (+40%). Exelon has been the best performer over the past year, gaining 44%. Exelon has also had the strong EPS growth of the five, growing annual EPS by 41%. ITC Holdings tops the group in profit efficiency, returning 5.2% on assets and 21% on equity. Overall, ITC is expected to outperform the market the most owing to its growth profile over the upcoming twelve months (4.76%). Exelon is the only stock that made it onto both group leaders lists. Next, we’ll look at which stocks have been performing best relative analyst earnings expectations: (click to enlarge) Source: QuantifiedAlpha.com We’ve found through historical back testing that stocks that beat earnings estimates consistently, are extremely likely to keep beating estimates. This is crucial as stock prices can experience wild swings in price depending on how earnings come out relative to expectations. Hawaiian Electric has the best track record, having beaten EPS estimates by 12% last quarter (6 straight beats) and revenue estimates by 8% (2 straight beats). Edison International (NYSE: EIX ) has the best track record for EPS, having beaten the Wall Street consensus EPS estimates 8 times in a row. PPL Corporation (NYSE: PPL ), Westar Energy, and NextEra Energy (NYSE: NEE ) are names we haven’t seen yet, that have all outperformed expectations as well. D) Conclusion Now that we’ve analyzed the sector as a whole and the individual group leaders in the group, it is time to see which utility stock comes out on top. The table below shows the electric utility stocks we expect to outperform the market the most: (click to enlarge) Source: QuantifiedAlpha.com Exelon comes out on top on our list, with our algorithms expecting the stock to outperform the overall market by 8.73% over the next twelve months. Exelon combines strong value with solid momentum and EPS growth. Entergy, Hawaiian Electric, and Westar Energy are other stocks that were featured earlier in the article that also look very attractive. While American Electric Power is featured at #4 on our overall leader board, we advise investors to stay away from the stock as it has been missing analyst estimates recently (hence the one star Earnings Strength rating). Though the Utility sector outperformed the general market during 2014, we feel the sector is still relatively undervalued and certain names look very attractive.

PPL Corp. To Reward Investors In 2015

Summary A low treasury yield environment and efforts to reduce competitive energy operations will support PPL’s performance. Efforts to reduce competitive energy operations will positively affect bottom-line numbers and cash flows. PPL is likely to give full-year 2015 earnings guidance during its Q4 2014 earnings call. Utility stocks’ high dividend yields make them attractive investment options for dividend-seeking investors. The utility sector, including PPL Corp. (NYSE: PPL ), performed better than the S&P 500 in 2014. The outperformance of the utility sector was mainly due to the low treasury yield environment. In 2015, I believe PPL will deliver a healthy financial performance due to the ongoing low treasury yield environment and efforts made by the company to lower its competitive energy operations, which will bode well for its EPS. The company has been aggressively working to sell and reduce competitive energy operations, as the competitive energy operations remain challenging. Also, the company offers a healthy dividend yield of 4.3%, supported by its cash flows, which makes it a good investment option for dividend-seeking investors. All Set for 2015 In 2014, the utility sector performed better than the S&P 500. The better performance can be mainly attributed to the low treasury yield environment. In 2015, the utility sector will continue to deliver a healthy performance due to the low yield environment and efforts undertaken by utility companies, including PPL, to reduce their competitive energy operations. The following table shows the performance of the S&P 500, the utility sector ETF (NYSEARCA: XLU ) and PPL. S&P 500 XLU PPL 2014 Performance 12% 25% 22% Source: Bloomberg.com. Due to the weak commodity prices and capacity revenues, competitive energy operations of U.S. utility companies have remained challenging in recent years. In the current environment, utility companies are choosing to reduce their competitive energy operations and making efforts to grow regulated operations. PPL has also been expanding its regulated operations and reducing competitive energy operations, which will positively affect its EPS. The company opted to spin off its competitive energy business operations. The spin-off is expected to be completed in the first half of 2015. The spin-off will allow PPL to focus and expand its regulated business operations. The company is anticipating cost savings of $75 million from the transaction. Also, PPL has finalized a deal to sell its Montana hydro assets to NorthWestern Energy for $0.9 billion . PPL is expected to use cash from the sale to invest in the expansion of its regulated operations. Separately, PPL is taking measures to expand its regulated transmission operations. The company has announced its plans to build a transmission line, and is expected to make capital expenditures of approximately $5 billion over the life of the project. The company has planned to start building the line in 2016-17, and it should be in service by 2023-25. The capital expenditure PPL is planning to make will positively affect its top- and bottom-line growth in the long term. The company will have 100% exposure to regulated business operations in the coming years, which will positively affect its financial performance. The chart below shows that the company has been making consistent and aggressive efforts to reduce its competitive energy operations, and PPL’s regulatory rate base is expected to grow by 6.3% on average from 2014-18. (click to enlarge) Source: Company reports. As the company is expanding its regulated business and is in the planning phase, it will give its 2015 EPS guidance range in the Q4 2015 earnings call next month. Also, the company is likely to update its long-term EPS guidance, which I believe will be in a range of 4%-6%. Along with the earnings growth potential, PPL offers a safe dividend yield of 4.3% , backed by its cash flows. Its attractive dividend yield makes it a good investment for dividend-seeking investors. The company has consistently increased dividends over the years. In the coming years, dividends offered by the company will grow as an increase in its regulated operations will portend well for its bottom-line numbers and cash flows. The following chart shows the dividend per share, dividend payout ratio and dividend coverage ratio for PPL from 2012-2014. (Note * Dividend coverage ratio = operating cash flow/annual dividends, and 2014 figures below are based on estimates). Dividend Per Share ($) Dividend Payout Ratio Dividend Coverage* 2012 $1.44 60% 3.3x 2013 $1.47 60% 3.25x 2014* $1.49 64% 3.2x Source: Company reports and calculations. Conclusion PPL is set to deliver a healthy performance in 2015. The low treasury yield environment and efforts to reduce competitive energy operations will support PPL’s performance in 2015. The company’s efforts to reduce competitive energy operations will positively affect its bottom-line numbers and cash flows. Also, the company is likely to give its full-year 2015 earnings guidance during the Q4 2014 earnings call, which will improve earnings visibility and bode well for the stock price. Also, the stock offers a safe dividend yield of 4.3%. Due to the aforementioned factors, I am bullish on PPL.

A Market Needing To Resolve Divergences In 2015

As 2014 has come to a close, investors have turned their attention to 2015 and looking for clues as to what the market and economy have in store for the new year. Below are divergences that unfolded in 2014 which raises the question of how they will be resolved this year. The resolution of these divergences will likely have implications on the performance of an investor portfolios this year. Oil Prices Knowing the stock market is not the economy and vice versa , determining factors contributing to the significant decline in oil prices is important. Certainly, increased supply is influencing the decline in crude prices. Equally though, as we have noted in several earlier articles, we believe lack of demand is also a contributing factor. The importance of the reduced demand leads strategists to raise the question of whether the global economy is entering a slowdown. To date, the U.S. seems to have shaken off the potentially negative impact of slowing economies outside its borders. Given the interconnectedness of the economic world today though, can the U.S. continue on its growth path while many other economies in the developed and emerging world struggle with growth? As the below chart indicates, historically, falling oil prices have been associated with slowing global GDP. Aubrey Basdeo, Managing Director at Blackrock, noted the potential negative impact of an extended run of low oil prices in an article late last year titled, Free Fallin’ . The article’s conclusion, Wherever the price ends up, it’s likely it’ll stay there for a while. We don’t see demand increasing, especially with China cooling off. In the short-term that could be good news for our economy – lower gas prices mean people have more money to spend – but it remains to be seen just how our country will be impacted by a sub-$60 oil price. The longer it stays low, though, the more difficult things could get. Highlighted in the Felder reference below was a comment by Howard Marks’ in a recent investor letter , “It’s historically unprecedented for the energy sector to witness this type of market downturn while the rest of the economy is operating normally. Like in 2002, we could see a scenario where the effects of this sector dislocation spread wider in a general ‘contagion.'” High Yield Bonds: Reduced Investor Risk Appetite The performance of high yield bonds has an above average positive correlation to the performance of equities. In short, as the economy grows, companies tend to experience better earnings growth. This improved earnings outlook generally leads to improved equity returns. Broadly, as companies generate better earnings growth, highly leveraged ones tend to experience an improved outlook as well. This in turn reduces the risk of default with highly leveraged companies. Consequently, high yield bond prices are bid up as investors are attracted to the higher yields provided by high yield debt in an environment where default risk seems lessened. A recent article by Jesse Felder of The Felder Report took an in depth look at the long term and short term price movements of high yield (NYSEARCA: HYG ) relative to a riskless 3-7 year Treasury ETF (NYSEARCA: IEI ) and the S&P 500 Index . As the first chart below shows, the high yield relative to treasury bond investment tracks closely with the S&P 500 Index. Felder notes in his article, Clearly, the chart above demonstrates that the strength in junk risk appetites led stocks off the lows back in 2009. Over the past summer, however, junk bonds started to lag stocks for the first time since the bull began (or lead lower, depending on your perspective). Since then the divergence has only gotten wider with each subsequent new high in the stock market [as seen in the below chart]: Large Caps Versus Small Caps And The Dollar The one asset allocation decision investors and advisers needed to get right in 2014 was to overweight U.S. equities, large caps more specifically, versus broad international. As can be seen in the two charts below, U.S. large cap stocks had a decisive performance edge versus developed international (NYSEARCA: EFA ), emerging markets (NYSEARCA: EEM ) and small cap equities (NYSEARCA: IWM ). With economies currently weaker outside the U.S. and interest rates lower in many European countries, foreign investors have allocated investment dollars to the U.S. This flow of funds into the U.S. has contributed to downward pressure on U.S. interest rates as well as continued upward pressure on the U.S. Dollar. The top chart above shows a longer view of the trade weighted US Dollar and its recent strength, although strong shorter term, the strength does not look exhausted when viewing the longer term chart. The implication of a stronger dollar has to do with the potential earnings headwind for large multinational companies. In a slow growing economy, the currency headwind can take a bite out of corporate profit growth. If this occurs, small and mid size companies are less exposed to exchange rates as business for these companies is mostly generated domestically. Lastly, the U.S. equity markets opened higher on the first trading day of the new year, but quickly turned lower near the time the ISM Manufacturing Index was reported. The manufacturing index was reported at 55.5 which was below consensus expectations of 57.5. This was the slowest rate of monthly growth in six months. Econoday noted, “growth in new orders slowed substantially, to 57.3 from November’s exceptionally strong 66.0, while backlog accumulation also slowed, to 52.5 from 55.0. Production slowed to 58.8 vs. 64.4….The abundant run of manufacturing reports point to year-end slowing in a sector which is oscillating going into the New Year.” The above highlights are just a few divergent factors that have developed recently. From a positive perspective, the equity markets have a tendency to climb the proverbial ” wall of worry .” We will cover more of our thoughts on these topics in our upcoming year end Investor Letter.