Tag Archives: lists

Best Multi-Asset ETFs For 2015

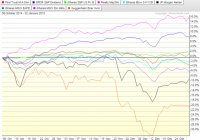
Summary MDIV remains the go to choice for a multi-asset ETF. Actively managed INKM saw its first test during a down market and it passed the test, outperforming the competition and emerging with an increased cash position. IYLD could find itself at the top of the heap at the end of 2015 if volatility remains elevated throughout the year. In last year’s article, The Best Multi-Asset ETF , I looked at which multi-asset ETFs were best under different conditions. Since the October 6 date of publication, there’s been a lot of volatility in the energy and currency markets, and several multi-asset ETFs were negatively impacted. For those who want a background on an individual fund, each of the seven ETFs was covered separately: Performance in Q4 2014 First, let’s look at a chart of the underlying assets held by most multi-asset ETFs. In the chart below are ETFs directly held by some multi-asset funds, or proxies which cover asset classes found in multi-asset funds. Along with MDIV are the SPDR S&P Dividend (NYSEARCA: DVY ), the iShares S&P U.S. Preferred Stock (NYSEARCA: PFF ), the iShares Cohen & Steers Realty Majors (NYSEARCA: ICF ), the iShares iBoxx $ High Yield Corporate Bond (NYSEARCA: HYG ), the JPMorgan Alerian MLP Index (NYSEARCA: AMJ ), the iShares MSCI EAFE (NYSEARCA: EFA ), the iShares MSCI Emerging Markets (NYSEARCA: EEM ) and the Guggenheim Canadian Energy Income (NYSEARCA: ENY ). (click to enlarge) That is a wide range of returns for a three-month period, partially because the start of the chart occurs during the early autumn sell-off in global markets. ICF doubled the return of its nearest competitor, which was dividend paying stocks. MDIV is in the middle of the pack along with preferred shares, junk bonds, and the EAFE. The big losses came from MLPs and Canroys, victims of the collapse in oil prices. Here’s a chart showing how multi-asset ETFs performed since October 6. (click to enlarge) Performance Review MDIV was given the title of Best Multi-Asset ETF because it spreads investments across asset classes such as REITs, MLPs, common stocks, preferred stocks, and junk bonds. The fund doesn’t take on extra risk to bump up its yield, incorporates some volatility factors in its model to reduce volatility, and should generally fall in the middle of the multi-asset ETF pack. MDIV gained 8.07 percent in 2014, and it mainly went sideways from October 6 on, gaining about 1.5 percent. MLPs are 20 percent of the portfolio and they under performed by a wide margin over the past three months, but REIT shares are also 20 percent of assets and they rallied more than MLPs fell. Overall, MDIV performed as expected, falling in the middle of the pack while delivering a positive return. GYLD was named the runner-up because it takes a global approach to the multi-asset model. However, enhanced risk was highlighted: GYLD used exposure to Venezuelan bonds and Canroys to achieve a higher yield. These assets were among the worst performers over the past three months and it led to a roughly 6 percent loss for the ETF. GYLD also fell 3.48 percent in 2014. As long as the U.S. dollar remains in a bull market, GYLD will struggle relative to domestic multi-asset ETFs, but energy is having a bigger impact on the portfolio. If energy remains weak, GYLD will lag the field. CVY was dubbed the “not-so-multi-asset-ETF” due to its hefty weight in common stocks, but it also made use of Canroys and MLPs to boost the portfolio’s total yield. The result was a heavy energy tilt: as of September 30, the most recent sector breakdown, CVY had 27 percent of assets in energy. This cost the fund over the past three months, and lowered CVY’s 2014 return to negative 4.33 percent. YDIV was the other poor performer over the past three months due to it being an international fund holding non-U.S. dollar assets. Australian and Canadian assets made up nearly 40 percent of assets back in September and 39 percent of the fund was in the two countries as of January 2, 2015. Australia and Canada are influenced by commodity prices, and Australian resource exports are hurt by the slowing Chinese economy. YDIV also has some assets in Chinese banks and Hong Kong companies, which raises the potential exposure to a China slowdown to more than 40 percent of assets. YDIV was going to underperform domestic multi-asset funds in 2014 no matter what simply due to being an international fund holding non-dollar assets, but it only fell 0.79 percent in 2014, and only 3.38 percent in the past three months because it isn’t directly exposed to commodities, specifically energy. This helped it beat both GYLD and CVY last year, two funds that were much more exposed to energy. IYLD was one of the stronger performers over the past three months because it mainly invests in bonds, to the tune of 75 percent of assets. Domestic dividend paying equities make up 10 percent of assets, with another 10 percent in international dividend paying equities, plus 5 percent in international real estate. IYLD also benefited from declining interest rates at the long-end; its 5 percent holding in the iShares Barclays 20+ Year Treasury (NYSEARCA: TLT ) was up 27 percent in 2014. IYLD rallied 10.29 percent for the full year and it climbed 1.88 percent in the past three months. The last two funds covered were FDIV and INKM, both actively managed. INKM’s performance was sub-par from its inception in April 2012, but financial markets enjoyed mostly smooth sailing for most of its life. Since October, INKM has beaten the multi-asset competition, gaining 3.41 percent in the past three months and 8.80 percent in 2014. INKM’s managers have adjusted the portfolio since September 25 (when I covered it here ). The fund raised cash from near 0 percent to 4 percent. High yield bonds are up from 6 percent to 9 percent. Equity exposure was cut from near 42 percent to 37 percent. Among individual holdings, the SPDR Barclays Long Term Treasury (NYSEARCA: TLO ) has climbed from 5.15 percent in September to 6.21 percent exposure. The SPDR Emerging Markets Dividend (NYSEARCA: EDIV ) was cut from 5.82 percent to 2.84 percent. The SPDR Dow Jones International Real Estate (NYSEARCA: RWX ) was raised from 4.85 percent to 6.23 percent. The SPDR Barclays High Yield Bond (NYSEARCA: JNK ) was increased from 6.09 percent to 8.95 percent. The SPDR Barclays Emerging Markets Local Bond (NYSEARCA: EBND ) was cut from 4.00 percent to 2.96 percent. One of the big questions with a fund such as INKM was how it might perform if markets moved against high-yield assets, such as due to rising interest rates. Long-term rates didn’t rise in late 2014, but energy prices tumbled, the dollar rallied sharply and high-yield bonds sold off. INKM managers navigated the past three months well and if they can keep it up, this fund will be a serious contender for investor capital. The 30-day SEC yield is still one of the lowest of the group at 3.25 percent, but if managers are able to mitigate losses during unfavorable periods for multi-asset ETFs, it could turn into a long-term outperformer. The other actively managed multi-asset ETF has a short history of only 5 months, but FDIV delivered similar results to INKM in the past three months, gaining 1.77 percent. Interestingly, FDIV’s managers moved in the opposite direction of INKM’s managers. Back on September 29, FDIV had 16.30 percent of assets in high-yield bonds and senior loans. As of January 2, the portfolio exposure to high-yield bonds was cut to 12.48 percent, with exposure to international sovereign bonds increased about 2 percentage points, MLP exposure increased 1 percentage point and dividend paying equities increased 1.5 points. FDIV has a 30-day SEC yield of 3.88 percent. After a rough period for multi-asset ETFs, both actively managed funds look more attractive today than they did three months ago. Best Fund For The Start of 2015 Assuming the U.S. dollar continues to strengthen, emerging markets and commodities remain weak and long-term interest rates do not rise, the following multi-asset ETFs look most attractive. For investors not worried about rising rates or trouble in high-yield bonds, but concerned about weakness in equities or MLPs, IYLD is a solid choice. It has 75 percent exposure to fixed income and a 5.83 percent yield, with dividends paid monthly. MDIV remains the go-to option for long-term passive investors. It won’t deliver big returns, but it yields 5.93 percent and also pays dividends monthly. If energy recovers and equities climb in 2015, MDIV will likely outperform IYLD. Given its track record over the past three months, INKM also looks attractive for total return investors who want active management. Of course, if you expect a big rebound in energy, GYLD or CVY look more attractive. GYLD currently yields 6.70 percent, but beyond risk of capital losses, there’s also the risk of dividend cuts if energy prices continue on their present trajectories.

Generating Alpha With A 2015 Model Portfolio

Summary 2015 will be a volatile year, and only the great stock pickers will come out significantly ahead. Don’t look for the needle in the haystack. Just buy the haystack! Taking the Jack Bogle approach might be the best way to mitigate risk and avoid unnecessary volatility. The first (and only) email request sent to SAFoundationalResearch@gmail.com was a request to create a model portfolio against the S&P 500. The weightings below are what we recommend for 2015: S&P 500 Recommendation Equity Sectors Weight Weight Difference Consumer Discretionary 12.0% 12.0% 0.0% Consumer Staples 9.9% 10.9% 1.0% Energy 8.3% 10.3% 2.0% Financials 16.5% 18.0% 1.5% Heathcare 14.5% 16.0% 1.5% Industrials 10.4% 8.9% -1.5% Information Technology 19.7% 19.7% 0.0% Materials 3.2% 3.2% 0.0% Telecom 2.3% 0.0% -2.3% Utilities 3.2% 1.0% -2.2% We fundamentally believe that 2015 will be a volatile year, and only the great stock pickers will come out significantly ahead. That being said, this portfolio will take the Jack Bogle approach and will strictly purchase SPDR ETFs. “Don’t look for the needle in the haystack. Just buy the haystack!” – Jack Bogle Some other rules for this $100,000 model portfolio: Opportunity to rebalance quarterly (but not required) Must be within +/-3% of the sector benchmark Must be at least 80% invested at all times Recommended $100,000 Model Portfolio Ticker Price as of Jan 2, 2015 Number of Shares Consumer Discretionary Select Sector SPDR ETF (NYSEARCA: XLY ) 72.15 166 Consumer Staples Select Sector SPDR ETF (NYSEARCA: XLP ) 48.49 224 Energy Select Sector SPDR ETF (NYSEARCA: XLE ) 79.16 130 Financial Select Sector SPDR ETF (NYSEARCA: XLF ) 24.73 727 Health Care Select Sector SPDR ETF (NYSEARCA: XLV ) 68.38 233 Industrial Select Sector SPDR ETF (NYSEARCA: XLI ) 56.58 157 Technology Select Sector SPDR ETF (NYSEARCA: XLK ) 41.35 476 Materials Select Sector SPDR ETF (NYSEARCA: XLB ) 48.58 65 Utilities Select Sector SPDR ETF (NYSEARCA: XLU ) 47.22 21 Cash 244.31 244.31 After this article, Foundational Research will post a series of articles for each sector and the respective industries. Below are some highlights on half of the sectors: Technology Sector Highlights We remain cautious on the technology sector, and recommend an equal weight. Although the sector, as measured by the XLK, has outperformed the broader market in 2015, much of that is due to AAPL, which accounts for more than 16% of the XLK index. We also believe the shift to cloud computing will have a negative impact on earnings for most large-cap technology companies, especially over the next few years, when the highest switching over/expenditure costs are expected. Valuations are also higher than they used to be, with overall tech trading at a 22% premium to the 5-year median P/E and a 70% premium to trough valuation, but the Technology sector still trades at a -9% discount to the S&P 500. Telecommunications Sector Highlights News flow continues to be almost exclusively negative in the telecommunications sector. Pricing is likely to continue to be a problem in wireless, and the wireline business is in secular decline. The negative pricing/promotion backdrop in wireless accelerated this past year. While the competitive condition may take a seasonal respite early this year following the holidays, the intermediate-term prospects in this regard is for more of the same, in our opinion. That is, more brutal competition. Energy Sector Highlights The downturn in crude oil prices and the prices for oil & natural gas-related stocks accelerated to the downside over the two quarters. Demand continued to suffer from weak economic conditions and/or slowing economic growth, particularly in the eurozone and China. At the same time, investors were spooked by ongoing strong oil production growth from US unconventional basins and the recovery of disrupted output from Libya. There was also the risk that the sanctions on Iran might be reduced or eliminated, potentially opening the way for increased production (approx. +500,000-700,000 barrels/d). Finally, OPEC was not able to come to an agreement to cut production to balance the market, leading to a sizeable drop in oil prices the day after Thanksgiving. We believe that the share prices have over-reacted to the crude oil price drop. Historically speaking, whenever energy stocks have lead decline for six months, they then lead for the following six months. “This time is different” often leads investors astray. Industrial Sector Highlights We are concerned that reductions to oil & gas capital spending budgets will have an outsized impact on the machinery and electrical equipment industries. There appears to be an expectation that better consumer spending trends following cheaper gasoline prices will spur further capital spending from the consumer discretionary sector. This may be the case, but we’d expect any pickup in capex from the discretionary sector to take time, while the cuts from the oil & gas complex will be more immediate. Additionally, sales into the oil & gas complex are among the most profitable for our companies, and will be difficult to replace (even if there is a pickup in consumer discretionary capex). Consumer Discretionary Highlights The market weight recommendation on the consumer discretionary sector reflects a more balanced view of the tailwinds and headwinds facing the group over this year. Fairly significant 2014 underperformance in the group has led to more reasonable relative valuations of late, and that, coupled with falling gas prices (a potential benefit to the consumer) and easing top line/margin comparisons in F15 have resulted in a more balanced risk/reward. That being said, many near-term macro data points remain mixed (i.e. jobs, housing, food commodity costs) and could keep a lid on overall earnings growth, which prevents a more constructive view on the group, for now. Material Sector Highlights Downstream is the new upstream. While we retain our neutral recommendation on the complex, we favor downstream/processed/refined-related commodity companies that benefit from the decline in upstream pricing. The perfect storm of increased production, stemming from higher prices, followed by slowing demand growth has resulted in a backdrop where many upstream commodities are in “oversupply.” The stronger United States dollar is only adding fuel to the fire. We would remain positioned in those commodities that benefit from falling inputs and oligopolic behavior. Our two preferred commodities are steel and aluminum, with the former capitalizing on falling iron ore prices, and the latter on falling power prices. We would avoid copper and iron ore where we have yet to see price support, as the cost curve continues to decline. Consumer Staples Highlights The third-quarter earnings results certainly did not encourage us to change our view. The operating environment remains challenging for packaged goods companies, especially so for food companies, yet the consumer staples sector continues to make new highs. Investors seem to continue to seek out yield, and probably even more so, stability, as we move toward year-end. Category growth remains sluggish in developing markets, and has slowed in emerging markets. The currency headwinds have intensified for many companies. Domestic attempts to drive volume with more promotions have not been as successful as in the past. The debate continues as to whether there has not been enough innovation or the consumer is still in a constrained in spending mode – we believe it has. Healthcare Highlights We continue to believe the Patient Protection and Affordable Care Act (ACA) will be a positive force in healthcare for the next 3-5 years, with some potential ramifications that need to be watched. As we approach year 2 of the expansion part of the law, Republicans have taken control of the Senate, and the Supreme Court has decided to review another case relating to the legislation. Scientific breakthroughs are creating a cornucopia of new biopharmaceuticals for unmet or poorly served medical needs. The demographics of the major industrialized nations, including North America, Europe, and Japan, are changing to larger populations of elderly patients, who are major consumers of drugs. Utilities Highlights We see nothing operationally wrong with the Utilities sector. The reach for yield has caused share prices to increase. Without a capex increase, and with prices as high as they are, we believe they will not appreciate any further. The last time the Utilities sector lead the market over the course of a year, as it did in 2014, it only returned 1% total return the next year. Over the next few weeks, we will go in-depth on each sector, so please remember to “Follow” us to not miss anything!

UNG Remains Around $15 – Will It Recover?

Summary The natural gas storage is projected to be lower than normal by the end of March. The short-term weather outlook is uncertain, but suggests warmer-than-normal weather, which could bring UNG back down. The extraction from storage is expected to be lower than normal this week. The price of The United States Natural Gas ETF (NYSEARCA: UNG ) ended the year with another tumble, as it dipped below $15 at one point. Currently, the price is around $15 – the lowest level UNG reached in the past couple of years. The high uncertainty around the weather forecasts for January didn’t stop investors from pulling out of UNG. The hotter-than-normal weather and slow rise in production maintains UNG at its current low level. Keep in mind, however, the natural gas storage is still low for the season, and is likely to remain low by the end of March. Storage extractions remain slow The last few storage reports showed that the extractions were very low for this time of the year. We could start seeing a trend developing in recent weeks. The chart below presents the changes in the natural gas underground storage and the price of UNG in the past couple of years. (Data Source: EIA, Google Finance) As you can see, the slope in storage this winter seems less steep than in previous winters. This could indicate that the natural gas market doesn’t heat up as it did last winter. The natural gas futures markets also show a trend – the once-high Backwardation for the four-month contracts recorded at the end of November has almost entirely dissipated. Currently, the future markets are mostly still in Backwardation, however, the gaps are very small. (Data Source: EIA) So the markets still expect a modest gain, at best, in the price of natural gas in the near term. After all, the EIA still expects the spot price to average at $4 during January. Long-time investors in natural gas know that this market view could change very promptly if the weather conditions change or any other unexpected event were to come to fruition. Looking forward, the EIA projects inventories will reach to 1,431 Bcf by the end of the extraction season (the end of March), which is still 225 Bcf below the 5-year average. Some analysts still expect the storage levels will rise to 4,000 Bcf by the end of the year – I remain skeptical about this outlook. Next week’s extraction from storage is likely to be lower than normal again, because last week’s deviation from normal temperatures was, on average, 7.12. This measurement tends to have a strong positive correlation (0.62) with the changes in the gap between the 5-year average extraction and current extraction. Another issue to consider is the ongoing growing natural gas production – current estimates are for a 3.1% gain in output in 2015, year over year. This growth rate will be slower than in 2014, but will still reduce the pressure on UNG prices. The rise in production continues, albeit the number of rigs remains low: Based on the recent update from Baker Hughes , the natural gas rotary rig count rose by 2 rigs to reach 340 rigs – nearly 9% below the levels recorded back in 2013. The drop in natural gas prices also had an adverse impact on natural gas producers such as Chesapeake Energy (NYSE: CHK ) – the company’s stock dropped by 11% during the past couple of months. For Chesapeake Energy, the plunge in oil prices also took its toll on its stock in recent weeks. Over the next two weeks, temperatures are expected to be above normal in the west and normal in other parts of the U.S., including the Northeast and the Midwest. Based on the National Oceanic and Atmospheric Administration , January’s weather remains highly uncertain, however. By the middle of January, the NOAA projects higher-than-normal temperatures in many parts of the U.S., including the West and the Northeast. NOAA also estimates below-normal temperatures in some regions, such as central and southern Great Plains. The hotter-than-normal weather and the slow extraction from storage are keeping UNG down. But the natural gas market won’t need much to drive UNG back up, including sharp changes in weather, a slowdown in output or a rise in the pace of depletion. For more see: ” Is Chesapeake Regaining Our Confidence? ”