Tag Archives: lists

3 Promising India Focused ETFs

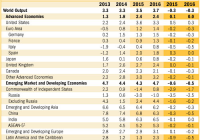
Summary India will overtake China’s GDP growth rate in 201 according to IMF and I believe that Indian equities are positioned for a multi-year bull market. Infrastructure is India’s biggest challenge as well as the biggest opportunity and I believe that the sector will perform well amidst lower interest rates in the foreseeable future. India’s consumption story has just commenced and with very favorable demographics, India’s consumption is likely to grow at a robust pace making the consumer related ETF attractive. While the focus has been on large companies in the recent rally in Indian markets, the small companies hold immense long-term potential and the small-cap ETF looks attractive. India is poised to overtake China’s GDP growth in 2016 according to the IMF and I have been bullish on India since the new government came to power in 2014. Recently, I wrote an article on IMFs GDP outlook for 2015 and 2016 where I opined that India and the US are the bright spots in the global economy and I also opined that India is likely to be the best performing equity market in 2015. I had also provided two stock picks and one ETF for exposure to Indian markets. In this article, I will be discussing three more ETFs that look very interesting considering a 2-3 year time horizon. I believe that these ETFs can serve as catalyst for the portfolio and investors need to diversify to India in order to boost overall portfolio returns. EG Shares India Infrastructure ETF (NYSEARCA: INXX ) The India Infrastructure ETF is designed to measure the market performance of companies in the infrastructure industry in India. For 2014, the ETF provided returns of 20% and I believe that the ETF will provide returns in excess of 20% in 2015. The reasons are as follows – The Indian central bank cut interest rates by 25 basis points recently and another 75-100 basis points interest rate cut is likely. Lower interest rates will trigger upside for the interest rate sensitive infrastructure sector. As the chart below shows, India needs infrastructure investment of nearly $1.25 trillion over the next 10-years and as the pace of investment grows under the new government, infrastructure companies are likely to outperform. (click to enlarge) The ETF has high exposure to large and very large infrastructure companies in India and therefore the exposure is with companies having strong fundamentals. The trailing PE ratio of the ETF holdings is 17.9, which is lower than the broader NIFTY PE of 22.2. Therefore, on a relative basis, the sector is still undervalued and has upside potential. For these strong reasons, the EG Shares India Infrastructure ETF is an interesting ETF to consider not only for 2015, but with a long-term investment horizon. EGShares India Consumer ETF (NYSEARCA: INCO ) As the name suggests, the India Consumer ETF is focused on the consumption theme. For 2014, the ETF provided an extraordinary return of 48%. While the same performance might not be replicated in 2015, the fund still looks very promising for strong returns over the next 3-5 years and a return of 15% to 20% in 2015 on a conservative basis. The Indian consumption theme has just commenced and Amazon (NASDAQ: AMZN ) clocking gross sales of $1 billion in the first year of operation in India is an indication of the potential the broad consumption theme holds in India. The PwC report is also upbeat on the media and entertainment sector in India for the next 5 years. Further, India is set to become the youngest country in the world by 2020 and the favourable demographics mean that India has huge potential when it come to consumption themes such as personal goods, automobiles, media and entertainment. The India Consumer ETF provides exposure to all these sectors of the economy with exposure to all the big players in the respective industries. I therefore expect the ETF to provide stellar returns considering a time horizon of 3-5 years. India Small-Cap Index ETF (NYSEARCA: SCIF ) I believe that the Indian Small-Cap Index ETF, which has provided returns of 43% in the last one year, is another excellent ETF to consider for 2015 as well as for the next 3-5 years. The above mentioned ETFs would give investors exposure to large or very large companies in India in the respective sectors. However, there is immense potential in some of the small or mid-sized companies in India. The growth for these companies can be robust if overall economic growth and sector growth is strong. With the ETF currently having 30.1% exposure to the financial sector, 21.1% exposure to the consumer discretionary sector and 17.6% exposure to the industrials sector, the outlook for the ETF will certainly be robust in 2015. In particular, the financial sector will surge on low inflation and rate cuts and both these factors will also impact the consumer discretionary and industrials sector. As of December 2014, the ETF had a very low PE of 11.24 and I believe that the ETF has strong upside in the coming quarters. In general, the broad market rally is led by large-caps followed by mid-caps and small-caps. Therefore, I expect the ETF to start moving significantly higher based on current valuations. Conclusion India is certainly one of the most attractive markets for 2015 and I believe that the Indian economy is on a path to sustained and robust growth in the next 5-10 years. Therefore, investors need to have Indian stocks in their portfolio and the ETFs discussed have the potential of providing 15% to 30% annual returns if the government keeps its promise on drastic policy changes in the coming months.

What Is Driving Up SLV Besides Gold?

The fall in the U.S. treasuries yields keeps up the price of SLV. The rally of gold is only partly related to the recovery of silver. Despite the recovery in silver prices, SLV’s silver holdings didn’t pick up. The silver market has started off the year on a positive note as shares of iShares Silver Trust (NYSEARCA: SLV ) added nearly 14% to their value (up to date). Is most of this recovery related to the rise in gold? Let’s reexamine the relation between silver and gold and further explore other factors that drive up SLV. Despite the progress of SLV in the past few weeks, its rally seems, at first glance, less related to the rise in gold prices. The chart below shows the linear correlation of gold and silver on a month-to-month basis (daily percent changes). Source: Bloomberg In the past month the linear correlation was around 0.615; even though this is still a significant and strong correlation, it’s also well below the levels recorded in the preceding months. Moreover, the ratio between SPDR Gold Trust (NYSEARCA: GLD ) and SLV has zigzagged with an unclear trend in recent weeks, as indicated in the chart below. Source: Google finance The ratio is still at a high level of around 7.2, which means GLD has still outperformed SLV in the past year. Some investors, however, might consider the high level of the GLD-to-SLV ratio as an indication that the latter is actually cheaper than the former. I put less faith in this assessment. This ratio could keep going up or remain at this level for a long time. After all, back in the early 90s the ratio between gold and silver started off at around 70 – this is the current ratio – and kept rising up to the low 90s and remained in the 70s and 80s range up to 1997. This doesn’t negate the fact that SLV’s recovery in the past few weeks was driven, in part, by the rise in gold. It only goes to show that other factors may have come into play in pushing up silver prices. One other factor to consider is the ongoing drop in long- and mid-term U.S. treasuries yields – they may have also contributed to the rise in SLV prices. The chart below shows the progress in the 7-year U.S. treasury yield and the price of SLV in the past several months. During the period presented below, the linear correlation between the two was around -0.3 – a mid-strong correlation. Source: Bloomberg and U.S Department of the Treasury Even though the FOMC is still expected to raise its interest rates, which are likely to bring back up the U.S. treasury yields in the second half of 2015, the recent developments in the markets including low inflation – mainly due the fall in oil prices – and higher economic uncertainty drove down U.S. treasuries yields. If yields continue to come down in the short term, this could keep pushing up the price of SLV. The recent developments in Europe including the Swiss National Bank’s decision to stop pegging its currency and ECB’s upcoming announcement of its QE program also seem to drive the demand for precious metals. In terms of growth of physical metal, this seems to play a secondary role, at best, in moving the price of silver. After all, China is one of the leading silver importers. The country recently published its fourth-quarter growth rate update; it showed a 7.4% growth in annual terms. This is slightly higher than market expectations of 7.3%. But this is still lower than its growth rate of 7.7%, which was recorded in the same quarter in 2013. This year, the World Bank estimates China’s GDP will expand by only 7.1% – this is 0.4 percentage points below its previous estimate back in June 2014. The IMF also revised down the global economic growth from 3.8% to 3.5% this year. A slower growth rate for China could suggest, at face value, a slower rise in the demand for silver. Lower growth in the world economy isn’t expected to increase the industrial demand for silver but it’s likely to drive more investors towards silver. This only serves as another indication that the demand for silver on paper leads the way for the price of SLV. But is the demand actually picking up for SLV? The chart below presents the changes in SLV’s silver holdings in the past few months. Source: SLV’s website Since the beginning of the year, silver holdings have actually slightly come down by 1.4% to 325 million ounces of silver. This could be an indication that some SLV investors have taken money off the table after the price of silver rallied. Looking forward, however, the recovery of silver is likely to slowly bring more people back to SLV. The silver market has seen a recovery in recent weeks. Over the short term, silver could keep rising especially if the global economy keeps showing slower growth. For more see: 3 Reasons to Prefer Silver Wheaton

Don’t Rely On Your Emotions To Trade The Oil Patch

An inflection point has been reached in oil’s valuation per barrel. The Oil/Gold ratio at this level has historically confirmed a trend change. The supply/demand news cycle is beginning to turn. (The Oil/Gold Ratio: click to enlarge) The first thing one sees in the chart (above) is an almost perfect symmetry, with each low point occurring early in Q1 on the red line (excepting 1986, 88, 89). It begs a question for the curious: Under what previous economic conditions did the oil/gold ratio reach today’s extremes? What is the correlation in barrels per oz. of gold?” “How far into this drop are we currently?” We are at Financial Crisis lows (2008-09); and the deep devaluations of the late-1980s are the only levels remaining to be pierced. The oil/gold ratio has been at this level three times in the last two decades, and each time it rallied. The current comparison clocks in at $45/bbl. How cheap is oil? Early this morning you could buy 28 barrels of oil with a single oz. of gold, the most in the modern era (excepting 1988). I am using the price of gold to value a barrel of crude because gold is a storage of value. Oil is a cultural commodity and the substrate of modern industrial society. In terms of financial comparisons, gold retains its value, oil we use ubiquitously. The ratio measures the cost of that use. Observe the parabolic surges in the chart below. Excepting the go-go years of impossibly cheap oil (1986 and 1989), each one of these telephone-pole tops flamed-out quickly. (click to enlarge) If zoomed-in for a closer look (below), you can see that the final weeks of the surge (red boxes) were composed of unsustainable, soaring price-gaps. For example, an ounce of gold this morning could buy you 33% more oil than on January 1, 2015, less than 3 weeks ago; or 60% more oil than in November, 2014! Is this any way to price a commodity that’s used 91ML bbl a day? In just the last week we have had several 5% up and down days close-by in sequence, resulting in single-session half-trillion dollar gains or losses for crude oil. This kind of price discovery only occurs near turning-points – when the market can’t figure out what something is worth – when all the news and analysis is clouded in total confusion – and hence the focus of this article. For ages, if you wanted to figure out what something was worth, you compared it to gold; and at this point, oil is as cheap as it gets. (click to enlarge) In my previous articles, I have used a pressure-cooker model to scale into positions through dollar-cost averaging, buying at gradual intervals over a few weeks time. This method sometimes takes weeks, even months, to fulfill, but in the end it works, because every tick down lowers the cost-basis before the eventual turn. The important thing is to begin near the extremes. Crude oil is selling for less than it takes to drill, ship and deliver it almost anywhere in the world. Some OPEC countries could actually default on their debts if crude oil remains in this state of devaluation. But there is hope on the horizon. An upcoming storm of lay-offs, falling rig counts, and production cuts is beginning to slash into the North American crude suppliers (the source of oversupply), and by 2Q’2015 this pullback should be in full swing. SA author Wolf Richter fully describes this retrenchment in his fiery articles . The trade here is to gradually buy into a crude oil ETF, for example, XLE , OIL , or USO , and hold until oil hits $70/bbl. For the more speculative investor, the leveraged ETFs – UCO (2x crude), or UWTI (3x crude) are also an option.