Tag Archives: lists

A New Biotech ETF Looks To Bring The Genomic Revolution To Investors

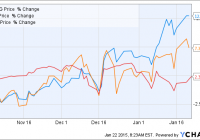
Summary The ARK Genomic Revolution Multi-Sector ETF launched last year with the goal of investing in companies that develop technologies related to extending and enhancing the quality of human life. The fund typically invests in about 40-50 names and is currently divided almost equally among all market capitalizations. The fund’s 0.95% expense ratio is currently the highest of the biotechnology ETFs. With biotechnology continuing to be the hot sector heading into 2015, we’ve seen several investment firms looking to capitalize on the trend. I’ve profiled a pair of those new biotech ETFs launched just recently here and here and another new one targeting a specific niche of the biotech universe began trading at the end of October of last year. The ARK Genomic Revolution Multi-Sector ETF (NYSEARCA: ARKG ) is from ARK Capital Management. Its primary investment objective according to the fund’s fact sheet is to identify securities that “are substantially focused on and are expected to substantially benefit from extending and enhancing the quality of human and other life by incorporating technological and scientific developments, improvements and advancements in genomics into their business. One such way this is accomplished is by offering new products or services that rely on genomic sequencing, analysis, synthesis or instrumentation.” This ETF typically invests in about 40-50 companies and isn’t necessarily looking for the next big diamond in the rough. According to the ARK Management website (which happens to update the holdings of this fund on a daily basis), the median market cap of one of its holdings is $5B. Illumina (NASDAQ: ILMN ) – the company that develops and manufactures tools for the analysis of gene sequencing – is the ETF’s current top holding but other big positions include popular names like Monsanto (NYSE: MON ), Biogen (NASDAQ: BIIB ) and even Qualcomm (NASDAQ: QCOM ). The fund doesn’t necessarily come cheap though. Its 1.45% expense ratio is currently the highest in the biotechnology ETF space easily outpacing the category average of 0.48% and the SPDR S&P 500 ETF (NYSEARCA: SPY ) ratio of just 0.09%. Management is currently capping the expense rate at its current management fee of 0.95% (administrative expenses of 0.50% are currently being waived although it’s still the highest in the sector). That’s not entirely unexpected as new funds establishing their portfolios for the first time tend to be more inefficient until the level of assets under management (currently at around $5M for this ETF currently) increases. Thanks to the continued popularity of biotechs the fund has gotten off to a fast start. Since its inception, the fund is up 13%. That’s well ahead of the iShares NASDAQ Biotechnology ETF (NASDAQ: IBB ) return of 7% and the S&P 500 return of 2%. ARKG data by YCharts Conclusion With biotechs in favor right now it’s not surprising to see niche ETFs like this popping up. The top holdings of this fund are actually fairly different from those of the Biotech Index ETF so it looks like there is some diversification potential here. The fund is off to a good start and the active management of the portfolio is a differentiator but it comes at a cost. The current expense ratio is a bit prohibitive and should be monitored to see if it comes in line with the sector average over time. Overall, investors looking for biotech exposure should consider this ETF for their portfolios. Now that you’ve read this, are you Bullish or Bearish on ? Bullish Bearish Sentiment on ( ) Thanks for sharing your thoughts. Why are you ? Submit & View Results Skip to results » Share this article with a colleague

Palladium ETF To Enjoy Another Year Of Strong Fundamentals

Summary Low gas prices are boosting car sales. As the car industry picks up, increased demand for catalytic converts will help boost palladium prices. Palladium’s role in the industrial space. The palladium-related exchange traded fund could shine this year as low gasoline prices and cheap bank loans help attract more new automobile buyers. The ETFS Physical Palladium Shares (NYSEArca: PALL ) has only increased 1.1% over the past year but could begin to pick up momentum in 2015. The palladium spot price is hovering around $777.3 per ounce Tuesday. Johnson Matthey Plc, a maker of catalytic converters for automobiles that uses palladium to reduce harmful emissions, projects demand for the precious metal will likely exceed supply for a fourth consecutive year in 2015, reports Laura Clarke for Bloomberg . Fueling the increased palladium demand, global car sales increased 3.4% in 2014 to a record 81.6 million vehicles. In the U.S., auto sales rose to an annualized rate of 17.2 million, the highest since November 2003. Morgan Stanley and Deutsche Bank AG both remain bullish on the palladium outlook because 70% of palladium demand comes from car-parts manufacturers. Specifically, an ounce of palladium supplies enough catalytic converters in about 10 vehicles. “Palladium is an exciting place to be because of its exposure to gasoline,” Scott Winship, a fund manager at Investec Asset Management, said in the article. “U.S. auto demand is incredibly strong and might even surpass previous peaks that we saw before the financial crisis.” Bolstering U.S. auto sales, near-zero interest rates, a stronger job market and cheap fuel costs are allowing American consumers to finally purchase some big-ticket items that they pushed off in the wake of the financial crisis. Cheaper fuel “might attract some drivers to buy a car when they otherwise wouldn’t have,” Jonathon Poskitt, the head of sales forecasting for Europe at LMC Automotive Ltd., said in the article. However, palladium investors may be wary of prices rising too quickly. When palladium jumped to a record in 2001, carmakers cut palladium demand by 40% the following year and shifted into platinum as a cheaper alternative. On the supply side, production has lagged consumption since 2012, with output declining in Russia and South Africa, the world’s top producers. Deutsche Bank calculates that the shortfall could diminish to 907,000 in ounces this year, compared to 1.2 million ounces in 2014, and the market will continue to see production deficits until at least 2020. “There’s a very bullish story there that’s going to play out in the long term,” Jeremy Baker, senior commodity strategist at Harcourt Investment Consulting AG, said in the article. “There is a good argument that palladium should outperform other precious metals.” ETFS Physical Palladium Shares (click to enlarge) Max Chen contributed to this article .

Materials ETFs Mauled By Falling Oil Prices

Summary Energy prices are falling. Low oil prices are weighing on the materials sector. Materials are experiencing lower activity on energy fallout. Oil’s slide has identified some winners at the sector level, namely consumer-related shares, but beyond the energy sector, there are some losers as well. Those losers include the materials sector, which was already scuffling heading into 2015. Last year, the Materials Select Sector SPDR ETF (NYSEARCA: XLB ) rose just 7.2%, including paid dividends. XLB’s 2014 showing was 630 basis points worse than the S&P 500, and enough to make the fund the second-worst of the nine sector SPDR ETFs, behind only the Energy Select Sector SPDR ETF (NYSEARCA: XLE ) . To this point in the new year, only three of the nine sector SPDRs have traded higher. XLB is not a member of that trio. In theory, materials stocks should be winner in a low energy price environment, because lower oil and gas prices reduce input costs for energy-intensive materials producers and chemicals manufacturers. In reality, that has not been the case. While the materials sector’s earnings warnings have not yet reached alarming heights, it is clear oil’s plunge is taking a toll on the sector. Of XLB’s top 10 holdings, a group that combines to make up about two-thirds of the ETF’s weight, only three have traded higher to start 2015. “The investment markets reflect these winners and losers in the economy. Consumer driven sectors of the market have performed quite well. The energy and commodity sectors of the market have not. Between oil stocks, the materials sector, and industrial and utility names in commodity-related businesses, roughly 20 percent of the S&P 500 is a loser with falling oil prices.” – Jones & Associates LyondellBasell Industries (NYSE: LYB ), one of XLB’s top 10 holdings, said that in the fourth quarter low oil prices will damp its margins. That after the company helped materials ETFs perform well in the first half of 2014 on the back of rising crude prices . A recent Morgan Stanley report highlighted PPG Industries (NYSE: PPG ), a top 10 holding in XLB, as one materials name that could endure lower oil prices, but the bank also identified Eastman Chemical (NYSE: EMN ), LyondellBasell and Dow Chemical as potentially challenged by lower oil prices. Those stocks combine to make up over 16% of XLB’s weight. XLB’s five-year correlation to The United States Oil ETF (NYSEARCA: USO ) is over 59%, according to State Street data . Materials Select Sector SPDR ETF (click to enlarge)