Tag Archives: nasdaqibb

40% Return In ~4 Months With Our IP Selected Healthcare Companies Since SA Publication

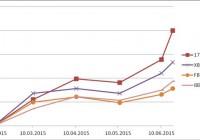
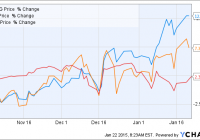
Summary Portfolio consisting of 17 healthcare companies would have returned nearly 40% from February 10th 2015 (date of article publication on SA) to June 18th 2015. Outperformance exclusively obtained with Patent Dynamics/Patterns (IP models) with XBI, FBT and IBB as benchmarks. Expert and/or financial analysis may be combined with such IP models for even better returns. Tickers covered: JAZZ, SAGE, TNXP, SGYP, ASPX, XNPT, INSM, RNN, NVDQ, ZSPH, ACUR, ICPT, RDHL, CORI, SPNC, EBIO and HAE. We wanted to know how the ” 17 Healthcare Companies To Consider Based On Patent Dynamics And IP/Patent Indexes ” performed since SA publication on February 10th 2015, namely JAZZ, SAGE, TNXP, SGYP, ASPX, XNPT, INSM, RNN, NVDQ, ZSPH, ACUR, ICPT, RDHL, CORI, SPNC, EBIO and HAE. Results below are impressive taking into account that these companies were only selected using Patent Dynamics/Patterns within these companies. This represents another evidence of the utility to take into account Patent Dynamics/Patterns in any investment selection process. Moreover, complementing or combining such patent filtering criteria with a financial/expert analysis and/or active management would have probably resulted in an even higher return on investment. Results: I. Performance of the 17 companies from February 10 th 2015 to June 18 th 2015 COMPANY TICKER EXCHANGE PERF% Synergy Pharmaceuticals SGYP NDQ 211.90 Corium International CORI NDQ 109.67 Sage Therapeutics SAGE NDQ 97.65 Acura Pharmaceuticals ACUR NDQ 83.33 Tonix Pharmaceuticals TNXP NDQ 77.55 Auspex Pharmaceuticals Inc ASPX NDQ 65.48 Redhill Biopharma Ltd RDHL NDQ 55.19 Insmed, Inc. INSM NDQ 51.36 Intercept Pharmaceuticals ICPT NDQ 32.01 ZS Pharma, Inc. ZSPH NDQ 24.15 Jazz Pharmaceuticals JAZZ NDQ 7.55 Haemonetics Corp HAE NYS 0.21 XenoPort, Inc. XNPT NDQ -3.34 Rexahn Pharmaceuticals, Inc. RNN NYS -9.33 Novadaq Technologies NVDQ NDQ -15.91 The Spectranetics Company SPNC NDQ -19.17 Eleven Biotherapeutics EBIO NDQ -74.21 70% of the companies have positive performance (30% negative). To note that ASPX was acquired by Teva Pharmaceuticals ( announcement on March 2015 ). II. What would have been the return of a portfolio composed of these 17 companies? A portfolio consisting of these 17 healthcare companies would have returned nearly 40% from February 10 th 2015 to June 18 th 2015 (in a bit more than four months) . This is to be compared with biotech ETFs like XBI, FBT or IBB returning respectively 26.66%, 15.67% and 18.73%. Hence, this represents a strong outperformance by applying Patent Dynamics/Patterns only versus benchmarks. Return is based on an equally weighted portfolio rebalanced each month. Cumulative performance of the 17 healthcare companies versus benchmarks (XBI, FBT and IBB) (click to enlarge) Table: Monthly performance and cumulative return of the 17 healthcare companies versus benchmarks (XBI, FBT and IBB) DATE MONTHLY PERF 17 Healthcare XBI-MONTH XBI FBT-MONTH FBT IBB-MONTH IBB 10.02.2015 N/A 100.00 N/A 100.00 N/A 100.00 N/A 100.00 10.03.2015 11.05 111.05 13.60 113.60 9.97 109.97 7.28 107.28 10.04.2015 7.75 119.66 1.77 115.61 2.02 112.19 4.69 112.31 11.05.2015 -1.32 118.08 -1.70 113.65 -2.18 109.75 -1.44 110.69 10.06.2015 8.26 127.84 7.38 122.03 3.17 113.22 3.84 114.95 18.06.2015 9.40 139.86 3.79 126.66 2.16 115.67 3.29 118.73 Focusing only on the Rating provided by the IP model (see article), we might have done even better in terms of performance by changing the weight of each company as the worst performer EBIO (-74.2%) had a Rating of D (worst form Ratings from A to D), whereas the two best performers SGYP (+211.9%) and CORI (+109.67%) had A Ratings. As mentioned, financial analysis and/or active management might have contributed as well to improve the performance. If we take for example the worst performer EBIO, disappointing results were released . Taking into account financial and/or expert analysis, one would have probably sold or reduced the weight of EBIO, see for example financial analysis indicated that caution was warranted , precursor sell signal or the comment from SA user businessofbiotech : “Eleven Bio’s lead product candidate fails in Phase 3 study; shares plunge 78% [ View news story ] Anyone with the slightest knowledge of dry eye and bit more attention to the press release of Phase 2 results would have never invested in this company. In their press release they mentioned they achieved statistical significance from baseline to end of tx, but not between the groups. They gave the false impression that their drug worked by showing decrease in the frequency of artificial tears (not an FDA approvable endpoint). The CEO knew the drug was a bust and she still took the company public on the false hope of their technology platform. Now she is trying to sell the hope that this drug will work in allergic conjunctivitis….One word- RUNNNN!!!” What to do next? The IP models provide some indications on what to do with those companies at the present time as their Grade, Score or Patent Index might have changed since the February publication (some slight modifications have been made to the models so the grade as published in February 2015 might not always correspond to the ones in the table below). The following recommendations are therefore only based on the IP models (with the exception of recent run up). It is recommended to combine the present IP approach with a financial and/or expert analysis. For JAZZ, Grade has changed from A to C, with a Score declining from 2 to 1, and with a present Patent Index (PI=3) smaller than the maximum Patent Index (PIMax=4). A PI

A New Biotech ETF Looks To Bring The Genomic Revolution To Investors

Summary The ARK Genomic Revolution Multi-Sector ETF launched last year with the goal of investing in companies that develop technologies related to extending and enhancing the quality of human life. The fund typically invests in about 40-50 names and is currently divided almost equally among all market capitalizations. The fund’s 0.95% expense ratio is currently the highest of the biotechnology ETFs. With biotechnology continuing to be the hot sector heading into 2015, we’ve seen several investment firms looking to capitalize on the trend. I’ve profiled a pair of those new biotech ETFs launched just recently here and here and another new one targeting a specific niche of the biotech universe began trading at the end of October of last year. The ARK Genomic Revolution Multi-Sector ETF (NYSEARCA: ARKG ) is from ARK Capital Management. Its primary investment objective according to the fund’s fact sheet is to identify securities that “are substantially focused on and are expected to substantially benefit from extending and enhancing the quality of human and other life by incorporating technological and scientific developments, improvements and advancements in genomics into their business. One such way this is accomplished is by offering new products or services that rely on genomic sequencing, analysis, synthesis or instrumentation.” This ETF typically invests in about 40-50 companies and isn’t necessarily looking for the next big diamond in the rough. According to the ARK Management website (which happens to update the holdings of this fund on a daily basis), the median market cap of one of its holdings is $5B. Illumina (NASDAQ: ILMN ) – the company that develops and manufactures tools for the analysis of gene sequencing – is the ETF’s current top holding but other big positions include popular names like Monsanto (NYSE: MON ), Biogen (NASDAQ: BIIB ) and even Qualcomm (NASDAQ: QCOM ). The fund doesn’t necessarily come cheap though. Its 1.45% expense ratio is currently the highest in the biotechnology ETF space easily outpacing the category average of 0.48% and the SPDR S&P 500 ETF (NYSEARCA: SPY ) ratio of just 0.09%. Management is currently capping the expense rate at its current management fee of 0.95% (administrative expenses of 0.50% are currently being waived although it’s still the highest in the sector). That’s not entirely unexpected as new funds establishing their portfolios for the first time tend to be more inefficient until the level of assets under management (currently at around $5M for this ETF currently) increases. Thanks to the continued popularity of biotechs the fund has gotten off to a fast start. Since its inception, the fund is up 13%. That’s well ahead of the iShares NASDAQ Biotechnology ETF (NASDAQ: IBB ) return of 7% and the S&P 500 return of 2%. ARKG data by YCharts Conclusion With biotechs in favor right now it’s not surprising to see niche ETFs like this popping up. The top holdings of this fund are actually fairly different from those of the Biotech Index ETF so it looks like there is some diversification potential here. The fund is off to a good start and the active management of the portfolio is a differentiator but it comes at a cost. The current expense ratio is a bit prohibitive and should be monitored to see if it comes in line with the sector average over time. Overall, investors looking for biotech exposure should consider this ETF for their portfolios. Now that you’ve read this, are you Bullish or Bearish on ? Bullish Bearish Sentiment on ( ) Thanks for sharing your thoughts. Why are you ? Submit & View Results Skip to results » Share this article with a colleague

A New Biotech ETF Targets Companies In Late Stage Clinical Trials

Summary ALPS Medical Breakthroughs ETF targets biotech and pharmaceutical companies with drugs in Stage II or Stage III clinical trials. This ETF looks for small cap and mid cap companies with greater liquidity and enough cash on hand to survive for at least two years. The management fee for this product is very reasonable compared to other similar products in the biotech area. The boom or bust nature of many of these companies makes it appropriate for only a smaller portion of your portfolio. ETF providers seem eager to take advantage of the popularity of biotechs recently. The biotech sector as measured by the iShares Nasdaq Biotechnology ETF (NASDAQ: IBB ) was up 34% in 2014 and has seen its assets more than double in the past 18 months. In addition, five new biotech ETFs have been launched since the end of 2014 and four of them are targeting unique niches within the biotech universe. I covered one of those ETFs – the BioShares Biotechnology Clinical Trials ETF (NASDAQ: BBC ) – recently and now another specialty biotech ETF has hit the market. The ALPS Medical Breakthroughs ETF (NYSEARCA: SBIO ) launched on December 31, 2014 and is targeting biotech and pharmaceutical companies that have one or more drugs currently in later stage clinical trials. According to the fund’s fact sheet , the company needs to meet the following criteria in order to be considered for inclusion in the ETF: U.S. listed biotech or pharmaceutical firm with 1 or more drugs in Phase II or Phase III FDA clinical trials Enough cash for 24 months at current burn rate Maximum weighting of 4.5% of assets at rebalance A market cap between $200 million and $5 billion Average daily volume > $1 million The fund mandate appears to be logical. Many of the big biotech firms have been having trouble getting new drugs in the pipeline so the focus here is to look instead at the smaller and midsize companies that have promising drugs that are potentially nearing approval. The benefit is two-fold. The approval of a drug that becomes successful in the market could become a huge cash cow for the company and for smaller companies like these could literally alter their landscape. The companies that have a newly approved drug could also end up being the target of a larger firm looking to add to their own channels. With an expense ratio of 0.50%, the management fee for this ETF is quite reasonable. Biotech is one of the sectors that most investors would benefit from putting the professionals in charge as researching and choosing investments individually among the drug companies can be quite cumbersome and costly if not done properly. It probably goes without saying though that the risk involved in these companies can be significant. Since we’re dealing with drugs that are in clinical trial but not yet approved, there’s a bit of a boom or bust proposition here as there’s no guarantee that any of these in-trial drugs will get approved. A drug that gets rejected represents months of work and millions in cost that will see no return on investment and therefore the volatility with these companies can be very high. Investors should only allocate a small portion of their portfolios to a product like this. Conclusion The idea of striking while the iron is hot is nothing new so it’s not surprising to see several new biotech ETFs popping up. This ETF’s focus is particularly intriguing as targeting biotech companies that are making significant investment in and progress towards developing new drugs can be quite lucrative to investors. The management style seems well thought out as well. The 24 months of cash requirement helps ensure that these companies will be around for a while and have the time and resources to develop their products. Looking for companies with a higher trading volume allows investors to buy and sell shares without that high bid-ask spreads that could make investment in these companies unnecessarily costly. Given the target niche of the biotech sector, the company selection philosophy and the reasonable cost, this ETF should be a consideration for investors looking for exposure to biotechs. Now that you’ve read this, are you Bullish or Bearish on ? Bullish Bearish Sentiment on ( ) Thanks for sharing your thoughts. Why are you ? Submit & View Results Skip to results » Share this article with a colleague