Tag Archives: learn-more

PBS Is Just What I’m Not Looking For In An ETF
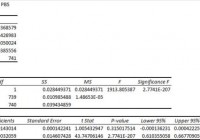
Summary I’m taking a look at PBS as a candidate for inclusion in my ETF portfolio. A limited underlying index, high standard deviations, moderate correlation, weak yields and high expense ratios make this a poor fit for my tastes. The best things going for the portfolio is decent (but not great) liquidity. I’m not assessing any tax impacts. Investors should check their own situation for tax exposure. Investors should be seeking to improve their risk-adjusted returns. I’m a big fan of using ETFs to achieve the risk-adjusted returns relative to the portfolios that a normal investor can generate for themselves after trading costs. I’m working on building a new portfolio and I’m going to be analyzing several of the ETFs that I am considering for my personal portfolio. One of the funds that I’m considering is the PowerShares Dynamic Media Portfolio (NYSEARCA: PBS ). I’ll be performing a substantial portion of my analysis along the lines of modern portfolio theory, so my goal is to find ways to minimize costs while achieving diversification to reduce my risk level. What does PBS do? PBS attempts to track the total return (before fees and expenses) of the Dynamic Media IntellidexSM Index. At least 90% of the assets are invested in funds included in this index. The index only includes the common stock of 30 companies, all of which are considered U.S. Media companies. PBS falls under the category of “Communications.” Does PBS provide diversification benefits to a portfolio? Each investor may hold a different portfolio, but I use (NYSEARCA: SPY ) as the basis for my analysis. I believe SPY, or another large cap U.S. fund with similar properties, represents the reasonable first step for many investors designing an ETF portfolio. Therefore, I start my diversification analysis by seeing how it works with SPY. I start with an ANOVA table: (click to enlarge) The correlation is mediocre at 85%. I want to see low correlations on my investments. Extremely low levels of correlation are wonderful for establishing a more stable portfolio. I consider anything under 50% to be extremely low. However, for equity securities an extremely low correlation is frequently only found when there are substantial issues with trading volumes that may distort the statistics. Standard deviation of daily returns (dividend adjusted, measured since January 2012) The standard deviation is great. For PBS it is .9703%. For SPY, it is 0.7300% for the same period. SPY usually beats other ETFs in this regard, but this combination of standard deviation and correlation isn’t going to do much good under modern portfolio theory. Liquidity looks acceptable Average trading volume isn’t very high, a bit over 40,000, but that also isn’t low enough to be a major concern for me. Mixing it with SPY I also run comparisons on the standard deviation of daily returns for the portfolio assuming that the portfolio is combined with the S&P 500. For research, I assume daily rebalancing because it dramatically simplifies the math. With a 50/50 weighting in a portfolio holding only SPY and PBS, the standard deviation of daily returns across the entire portfolio is 0.8182%. With 80% in SPY and 20% in PBS, the standard deviation of the portfolio would have been .7558%. If an investor wanted to use PBS as a supplement to their portfolio, the standard deviation across the portfolio with 95% in SPY and 5% in PBS would have been .7352%. Why I use standard deviation of daily returns I don’t believe historical returns have predictive power for future returns, but I do believe historical values for standard deviations of returns relative to other ETFs have some predictive power on future risks and correlations. Yield & Taxes The distribution yield is .50%. I simply don’t see this as a useful holding for retiring investors. The combination of mediocre correlation and high standard deviation results in an ETF that is unlikely to lower the total risk profile of the portfolio unless it was used in phenomenally small amounts. The distribution yield is weak, which means retiring investors may have a stronger temptation to sell shares if their income is too low. The point of building the portfolio with ETFs is to avoid active management outside of rebalancing. I can deal with a weak yield because I’m far from retirement, but it is starting to feel like the ETF is looking for a fairly small niche to fill. I’m not a CPA or CFP, so I’m not assessing any tax impacts. Expense Ratio The ETF is posting .62% for a gross expense ratio, and .62% for a net expense ratio. I want diversification, I want stability, and I don’t want to pay for them. For an ETF that already left me wanting more in most categories, being hit with a big expense ratio isn’t the way to draw me back in. Market to NAV The ETF is at a .04% premium to NAV currently. Premiums or discounts to NAV can change very quickly so investors should check prior to putting in an order. The ETF is large enough and liquid enough that I would expect the ETF to stay fairly close to NAV. Generally, I don’t trust deviations from NAV and I will have a strong resistance to paying a premium to NAV to enter into a position. Largest Holdings The diversification can’t be very good when there are only 30 companies in the underlying index. The chart below supports that assessment. The top seven companies are each more than 5% of the total holdings. (click to enlarge) Conclusion I’m currently screening a large volume of ETFs for my own portfolio. The portfolio I’m building is through Schwab, so I’m able to trade PBS with no commissions. I have a strong preference for researching ETFs that are free to trade in my account, so most of my research will be on ETFs that fall under the “ETF OneSource” program. PBS won’t make the next round of comparison. It feels like the ETF would be most useful for making short-term bets on the sector. Some sector ETFs can provide additional value to a portfolio by improving the balance of different exposures, but I don’t see that benefit here.
PowerShares QQQ’s 2014 And Fourth-Quarter Performance And Seasonality

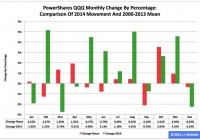
Summary PowerShares QQQ behaved better in 2014 than the three most popular exchange-traded funds based on the S&P 1500’s constituent indexes. However, the derivative of the Nasdaq-100 Index dominated by information technology was not a leader, but a laggard in the fourth quarter. Neither major central bank policies nor related moves in the euro and U.S. dollar currency pair appear likely to help the fund’s performance in the first quarter. The PowerShares QQQ Trust ETF (NASDAQ: QQQ ) had a supercharged 2014, as the ETF skyrocketed to $103.25 from $86.63, a soaring of $16.62, or 19.19 percent, on an adjusted closing daily share price basis. During the year, it outdistanced the SPDR S&P 500 ETF (NYSEARCA: SPY ) by 5.72 percentage points, the SPDR S&P MidCap 400 Trust ETF (NYSEARCA: MDY ) by 9.79 points and the iShares Core S&P Small-Cap ETF (NYSEARCA: IJR ) by 13.34 points. Over the fourth quarter, however, QQQ lost momentum on a relative basis, as it lagged IJR and MDY by -4.89 and -1.40 percentage points, in that order, and led SPY by a measly 0.01 point. Consistent with its seasonal tendency, QQQ capped a very good 2014 with a very bad December, as it was outpaced by IJR, MDY and SPY by -5.14, -3.08 and -1.99 percentage points, respectively. Figure 1: QQQ Monthly Change, 2014 Vs. 2000-2013 Mean (click to enlarge) Source: This J.J.’s Risky Business chart is based on analyses of adjusted closing monthly share prices at Yahoo Finance . QQQ behaved a lot better in 2014 than it did during its initial 14 full years of existence based on the monthly means calculated by employing data associated with that historical time frame (Figure 1). The same data set shows the average year’s weakest quarter was the third, with a relatively large negative return, and its strongest quarter was the fourth, with an absolutely large positive return. Inconsistent with this pattern, the ETF last year made its biggest advances in Q2 and Q3, in that order. Figure 2: QQQ Monthly Change, 2014 Vs. 2000-2013 Median (click to enlarge) Source: This J.J.’s Risky Business chart is based on analyses of adjusted closing monthly share prices at Yahoo Finance. QQQ also behaved a lot better in 2014 than it did during its initial 14 full years of existence based on the monthly medians calculated by using data associated with that historical time frame (Figure 2). The same data set shows the average year’s weakest quarter was the first, with a relatively small positive return, and its strongest quarter was the fourth, with an absolutely large positive return. Clearly, this means there is no historical statistical tendency for the ETF to explode in Q1. Figure 3: PowerShares QQQ Top 10 Holdings, Jan. 6 (click to enlarge) Note: The QQQ holding-weight-by-percentage scale is on the left (green), and the company price/earnings-to-growth ratio scale is on the right (red). Source: This J.J.’s Risky Business chart is based on data at Invesco’s PowerShares QQQ microsite and Yahoo Finance (both current as of Jan. 6). I anticipate one of the biggest headwinds buffeting the large-capitalization QQQ in the first quarter of this year may be the bias divergence in monetary policy at major central banks around the world. On the one hand, the U.S. Federal Reserve is oriented toward tightening; on the other hand, the Bank of Japan, European Central Bank and People’s Bank of China are oriented toward loosening. This divergence has had important effects on exchange rates, such as in the euro and U.S. dollar currency pair, or EUR/USD. It is worth mentioning in this context that the Fed announced the end of asset purchases under its latest quantitative easing program, aka QE3+, Oct. 29, and may announce the beginning of interest rate hikes April 29. Its conclusion of purchases under its first two formal QE programs this century is associated with both a correction and a bear market in large cap equities, as evidenced by SPY’s slipping -17.19 percent in 2010 and sliding -21.69 percent in 2011. The bias divergence at the major central banks has been reflected by action in the EUR/USD cross, which dipped from as high as $1.3992 May 8 to as low as $1.1880 Jan. 5, a drop of -$0.2112, or -15.09 percent, based on data at StockCharts.com . This change in EUR/USD and similar moves in other currency pairs indicate a strengthening greenback and a weakening everything else that could pressure earnings of U.S. companies in sectors with substantial international businesses. Clearly, many technology companies fit this description. In terms of exposure to the tech sector, Invesco reported QQQ’s is 58.07 percent at this time. Meanwhile, valuation may become increasingly important to stock market participants in the short to intermediate terms, especially given the synchronized slowdowns in national (and supranational) economies around the world. Except for Gilead Sciences Inc. (NASDAQ: GILD ), QQQ’s top 10 holdings appear to range from fairly valued to overvalued to absurdly valued (Figure 3). And these kinds of valuations seem unlikely to function as tailwinds for the ETF this quarter. Disclaimer: The opinions expressed herein by the author do not constitute an investment recommendation, and they are unsuitable for employment in the making of investment decisions. The opinions expressed herein address only certain aspects of potential investment in any securities and cannot substitute for comprehensive investment analysis. The opinions expressed herein are based on an incomplete set of information, illustrative in nature, and limited in scope. In addition, the opinions expressed herein reflect the author’s best judgment as of the date of publication, and they are subject to change without notice.

CROP Isn’t Growing Fast Enough, Even The Discount To NAV Will Not Attract Me

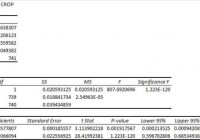
Summary I’m taking a look at CROP as a candidate for inclusion in my ETF portfolio. The expense ratio seems to be justified by not being market weighted, but the diversification within the fund is weak. The correlation to SPY is easily the most attractive characteristic, but it is combined with moderate volatility and very weak returns. I’m not assessing any tax impacts. Investors should check their own situation for tax exposure. Investors should be seeking to improve their risk adjusted returns. I’m a big fan of using ETFs to achieve the risk adjusted returns relative to the portfolios that a normal investor can generate for themselves after trading costs. I’m working on building a new portfolio and I’m going to be analyzing several of the ETFs that I am considering for my personal portfolio. One of the funds that I’m considering is the IQ Global Agribusiness Small Cap ETF (NYSEARCA: CROP ). I’ll be performing a substantial portion of my analysis along the lines of modern portfolio theory, so my goal is to find ways to minimize costs while achieving diversification to reduce my risk level. What does CROP do? CROP attempts to track the total return (before fees and expenses) of the IQ Global Agribusiness Small Cap Index. According to the prospectus, the underlying index “is a rules based, modified capitalization weighted, float adjusted index.” I can appreciate having a weighting system other than simple market capitalization. Weighting by market cap is very easy; the ETF simply buys up the initial amount of shares in each fund and maintains the position. In this case, the ETF is not using a simple market cap weighting. In my opinion, that would justify a slightly higher expense ratio. CROP falls under the category of “Consumer Defensive.” Does CROP provide diversification benefits to a portfolio? Each investor may hold a different portfolio, but I use the SPDR S&P 500 Trust ETF (NYSEARCA: SPY ) as the basis for my analysis. I believe SPY, or another large cap U.S. fund with similar properties, represents the reasonable first step for many investors designing an ETF portfolio. Therefore, I start my diversification analysis by seeing how it works with SPY. I start with an ANOVA table: (click to enlarge) The correlation is excellent at 72%. I want to see low correlations on my investments. Extremely low levels of correlation are wonderful for establishing a more stable portfolio. I consider anything under 50% to be extremely low. However, for equity securities an extremely low correlation is frequently only found when there are substantial issues with trading volumes that may distort the statistics. Standard deviation of daily returns (dividend adjusted, measured since January 2012) The standard deviation is great. For CROP it is .8229%. For SPY, it is .7300% for the same period. SPY usually beats other ETFs in this regard. I like the low correlation and it could be enough to cover the higher standard deviation once we start looking at allocations within a portfolio. Liquidity looks mediocre Average trading volume is pretty low, a bit over 11,000. That isn’t low enough to eliminate it from my consideration, but it is a concern. I’m writing this while the market is open, and the current spread is .36%. That’s a big enough spread to pay attention to when putting in an order. Of course, spreads can change constantly, but investors here should make sure they are using limit orders to prevent crossing a large spread. Mixing it with SPY I also run comparisons on the standard deviation of daily returns for the portfolio assuming that the portfolio is combined with the S&P 500. For research, I assume daily rebalancing because it dramatically simplifies the math. With a 50/50 weighting in a portfolio holding only SPY and CROP, the standard deviation of daily returns across the entire portfolio is .7208%. With 80% in SPY and 20% in CROP, the standard deviation of the portfolio would have been .7121%. If an investor wanted to use CROP as a supplement to their portfolio, the standard deviation across the portfolio with 95% in SPY and 5% in CROP would have been .7238%. Why I use standard deviation of daily returns I don’t believe historical returns have predictive power for future returns, but I do believe historical values for standard deviations of returns relative to other ETFs have some predictive power on future risks and correlations. Yield & Taxes The distribution yield is 1.63%. I like to see strong yields for retiring portfolios because I don’t want to touch the principal. By investing in ETFs I’m removing some of the human emotions, such as panic. Higher yields imply lower growth rates (without reinvestment) over the long term, but that is an acceptable trade off in my opinion. The weak yield makes me less excited about the portfolio from a retirement standpoint, but I have a long ways to go before I’m there. I’m not a CPA or CFP, so I’m not assessing any tax impacts. Expense Ratio The ETF is posting .75% for a gross expense ratio, and .75% for a net expense ratio. I want diversification, I want stability, and I don’t want to pay for them. The expense ratio on this fund is higher than I want to pay for equity securities, but having a better system than a simple market cap weighting provides some justification for the higher ratio. Market to NAV The ETF is at a .96% discount to NAV currently. Premiums or discounts to NAV can change very quickly so investors should check prior to putting in an order. Largest Holdings The diversification within the ETF is very weak. While the weighting method provided some justification for a higher expense ratio, the poor diversification within the holdings severely damages that justification. Rebalancing the fund may require some costs, but having fewer positions to rebalance reduces those costs. (click to enlarge) After looking at the diversification level within the ETF, I’m more critical of the expense ratio. Conclusion I’m currently screening a large volume of ETFs for my own portfolio. The portfolio I’m building is through Schwab, so I’m able to trade CROP with no commissions. I have a strong preference for researching ETFs that are free to trade in my account, so most of my research will be on ETFs that fall under the “ETF OneSource” program. For a correlation of 72% and more volatility than SPY, I would have expected the ETF to have more significant returns. I don’t believe in using past performance to predict future performance, but if an ETF shows moderate or higher correlation and weak performance, it makes me doubtful. During the time period I used (almost 3 years) SPY went up by over 66%. Crop went up by 14%. That isn’t terrible if the ETF is extremely low risk, but for something with even a moderate correlation to SPY it feels like pretty weak performance. I’m going to be knocking CROP off my list. Despite what initially appeared to be solid diversification benefits when combined with SPY, there have been no other positives outside of the discount to NAV. While I like buying an ETF at a discount to NAV, it needs to be an ETF that I actually want to own. Additional disclosure: Information in this article represents the opinion of the analyst. All statements are represented as opinions, rather than facts, and should not be construed as advice to buy or sell a security. Ratings of “outperform” and “underperform” reflect the analyst’s estimation of a divergence between the market value for a security and the price that would be appropriate given the potential for risks and returns relative to other securities. The analyst does not know your particular objectives for returns or constraints upon investing. All investors are encouraged to do their own research before making any investment decision. Information is regularly obtained from Yahoo Finance, Google Finance, and SEC Database. If Yahoo, Google, or the SEC database contained faulty or old information it could be incorporated into my analysis. The analyst holds a diversified portfolio including mutual funds or index funds which may include a small long exposure to the stock.