Tag Archives: learn-more

A New One Of A Kind Biotech ETF Hits The Market

Summary LifeSci Index Partners has just launched the BioShares Biotechnology Clinical Trials ETF. This ETF focuses on just those biotech firms with a primary product offering that is in a Phase 1, Phase 2 or Phase 3 clinical trial stage of development. Given that these companies have no current product sales, many of the stocks in this portfolio are essentially boom or bust propositions. This fund is the only one in the ETF universe that offers exclusive focus to these clinical trial firms. Biotechnology stocks have soared this past year – the iShares Nasdaq Biotechnology Index Fund (NASDAQ: IBB ) returned an impressive 34% in 2014 – so it’s not surprising that companies are stepping up their biotech offerings in order to take advantage of current demand. One of those offerings that hit the market in just the last week is attempting to differentiate itself by targeting a very unique niche of the market. The BioShares Biotechnology Clinical Trials ETF (NASDAQ: BBC ) invests in biotech firms with a primary product offering that is in a Phase 1, Phase 2 or Phase 3 clinical trial stage of development. According to the fund’s fact sheet: Clinical trials stage companies are typically younger, smaller companies which do not have a drug approved but instead focus on testing their experimental drug candidates in human clinical trials. While many biotech focused ETFs invest in these types of firms, this is believed to be the only ETF out there that focuses on these types of companies. Most biotech ETFs tend to be more heavily weighted towards the big established names. In the aforementioned iShares Biotechnology Index Fund, every one of the top nine holdings in the ETF which happens to include over 53% of the ETF’s total assets fall into the Large Growth Morningstar style box. These top holdings include titans like Biogen (NASDAQ: BIIB ), Celgene (NASDAQ: CELG ) and Amgen (NASDAQ: AMGN ). That’s fine if you want broad exposure to the biggest and baddest names in the sector but it doesn’t do you much good if you want to invest in the little guys who are trying to break out in the sector or have a promising new drug in the pipeline. Researching and investing in these names individually can be cumbersome, costly and very risky. Being able to invest in a broad basket of these types of companies (the fund has 68 holdings in all) represents a niche that could really appeal to investors. Top holdings in this ETF currently include Sage Therapeutics (NASDAQ: SAGE ), Infinity Pharmaceuticals (NASDAQ: INFI ) and Prothena (NASDAQ: PRTA ). The fund is still in its infancy but initial signs are positive. The fund has a mere $3M in assets, but it does trade around 35,000 shares a day currently, so liquidity is slowly becoming less of an issue. Plus, investors need to consider the risk in an ETF such as this. Given that these companies have no actual product sales and just experimental drugs in the pipeline, they’re essentially boom or bust propositions and should be considered risky. Conclusion It’s easy to trade individual stocks when they’re well followed and well researched but an ETF is perfect for a niche product such as this. The 0.85% expense ratio isn’t particularly onerous considering you’ve got biotech specialists managing the product for you. Given biotech’s current popularity and the fact that there doesn’t appear ETF offering exclusive exposure to these clinical trial firms, this ETF should have some success carving out a special niche for investors. Now that you’ve read this, are you Bullish or Bearish on ? Bullish Bearish Sentiment on ( ) Thanks for sharing your thoughts. Why are you ? Submit & View Results Skip to results » Share this article with a colleague

FEU Provides Appealing Exposure To Europe

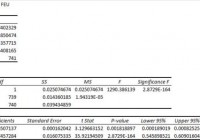
Summary I’m taking a look at FEU as a candidate for inclusion in my ETF portfolio. The correlation with SPY isn’t bad, and the overall risk level for a portfolio seems respectable. The expense ratio is a little bit high and the diversification is weak. I’ll keep FEU on the list as a possibility. I’m not assessing any tax impacts. Investors should check their own situation for tax exposure. Investors should be seeking to improve their risk adjusted returns. I’m a big fan of using ETFs to achieve the risk adjusted returns relative to the portfolios that a normal investor can generate for themselves after trading costs. I’m working on building a new portfolio and I’m going to be analyzing several of the ETFs that I am considering for my personal portfolio. One of the funds that I’m considering is the SPDR STOXX Europe 50 ETF (NYSEARCA: FEU ). I’ll be performing a substantial portion of my analysis along the lines of modern portfolio theory, so my goal is to find ways to minimize costs while achieving diversification to reduce my risk level. What does FEU do? FEU attempts to provide results which are comparable (before fees and expenses) to the total return of the STOXX Europe 50 Index. FEU falls under the category of “Europe Stock.” Does FEU provide diversification benefits to a portfolio? Each investor may hold a different portfolio, but I use the SPDR S&P 500 Trust ETF (NYSEARCA: SPY ) as the basis for my analysis. I believe SPY, or another large cap U.S. fund with similar properties, represents the reasonable first step for many investors designing an ETF portfolio. Therefore, I start my diversification analysis by seeing how it works with SPY. I start with an ANOVA table: (click to enlarge) The correlation is about 80%, which is great for Modern Portfolio Theory. The lower correlation makes it much easier to mix the ETF into a portfolio and take advantage of the benefits of diversification. My goal is risk adjusted returns, and my method is minimizing risk. Standard deviation of daily returns (dividend adjusted, measured since January 2012) The standard deviation is moderately high, but not terrible. For FEU it is 1.0080%. For SPY, it is 0.7300% for the same period. SPY usually beats other ETFs in this regard, and the low correlation with SPY makes the higher standard deviation acceptable. So far, the ETF is look fairly solid in my first pass. Mixing it with SPY I also run comparisons on the standard deviation of daily returns for the portfolio assuming that the portfolio is combined with the S&P 500. For research, I assume daily rebalancing because it dramatically simplifies the math. With a 50/50 weighting in a portfolio holding only SPY and FEU, the standard deviation of daily returns across the entire portfolio is 0.8250%. If an investor wanted to use FEU as a supplement to their portfolio, the standard deviation across the portfolio with 95% in SPY and 5% in FEU would have been .7343%. In my opinion, the standard deviation across the portfolio looks fine with a moderate position in FEU. In my opinion, a reasonable exposure based on the deviation is probably in the 5 to 10% range. Anything over 20% gets too risky. Average Volume The average volume was recently around 65,000 shares per day. That isn’t high, but it is enough that I would be comfortable holding the shares and believe the liquidity was good enough for the statistical values for correlation to be reliable. Why I use standard deviation of daily returns I don’t believe historical returns have predictive power for future returns, but I do believe historical values for standard deviations of returns relative to other ETFs have some predictive power on future risks and correlations. Yield & Taxes The distribution yield is 5.40%. The SEC yield is 2.64%. That’s a fairly strong yield, though I’d caution investors to research the source of the yields and the tax implications for their individual situation. I’m not a CPA or CFP, so I’m not assessing any tax impacts. Expense Ratio The ETF is posting .29% for an expense ratio. I want diversification, I want stability, and I don’t want to pay for them. The expense ratio on this fund is higher than I want to pay for an equity fund, but it isn’t enough to disqualify the ETF from consideration. Market to NAV The ETF is at a .81% premium to NAV currently. Premiums or discounts to NAV can change very quickly so investors should check prior to putting in an order. I wouldn’t want to pay a premium greater than .1% when investing in an ETF, unless I could find a solid accounting reason for the premium to exist. I certainly won’t be paying a .81% premium to buy into FEU without finding a solid reason for the premium. Largest Holdings The diversification is fairly weak. Given that the name included “Europe 50,” investors should expect the diversification to be weak. However, modern portfolio theory still says the overall level of risk introduced to the portfolio through a small to moderate position (5 to 10%) is acceptable. (click to enlarge) Conclusion I’m currently screening a large volume of ETFs for my own portfolio. The portfolio I’m building is through Schwab, so I’m able to trade FEU with no commissions. I have a strong preference for researching ETFs that are free to trade in my account, so most of my research will be on ETFs that fall under the “ETF OneSource” program. I’ll keep FEU on my list as a possibility for exposure to Europe as part of my international diversification. If I entered into a position in FEU it would be with a limit order that refused to pay the premium to NAV. Since the NAV could change suddenly, I’d have to do single day limit orders to reduce my risk of paying more than NAV. Additional disclosure: Information in this article represents the opinion of the analyst. All statements are represented as opinions, rather than facts, and should not be construed as advice to buy or sell a security. Ratings of “outperform” and “underperform” reflect the analyst’s estimation of a divergence between the market value for a security and the price that would be appropriate given the potential for risks and returns relative to other securities. The analyst does not know your particular objectives for returns or constraints upon investing. All investors are encouraged to do their own research before making any investment decision. Information is regularly obtained from Yahoo Finance, Google Finance, and SEC Database. If Yahoo, Google, or the SEC database contained faulty or old information it could be incorporated into my analysis. The analyst holds a diversified portfolio including mutual funds or index funds which may include a small long exposure to the stock.

Why Exelon Corporation Will Outperform The Market In 2015

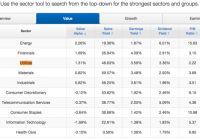
The strong rally in utilities will continue into 2015, despite statements to the contrary from analysts, as the sector is still strongly undervalued relative to the market. Exelon combines an attractive valuation with strong price momentum and EPS growth. We expect the stock to outperform the market by 8.7% over the next 12 months. Entergy Corporation, Hawaiian Electric, and Westar Energy are other electric utilities that look poised to outperform the market in 2015. A) Introduction The Utilities sector surprised many by posting the best price performance in the market in 2014. Electric utility companies were a particularly strong subset of the sector, posting an average gain of 31% during the course of the year. At this point, many investors are questioning whether the current rally will continue, especially with rising interest rates on the horizon (high interest rates hurt utilities). On Wednesday, Michael Purves, the head of equity derivatives research at Weeden & Co, advised investors to “start to take profits given the run is getting long in the teeth.” Contrary to common sentiment, we feel the sector’s momentum and growth should serve a signal of further outperformance, as the sector is still strongly undervalued relative to the overall market. Investors unfamiliar to our style of analysis should know that we solely look at metrics that have a long historical track record of predicting stock returns. We’ll first analyze how the overall Utility sector stacks up to the other nine sectors in ten metrics that have been academically shown to predict returns. Then, we’ll look into which stocks within the Electrical Utility industry group look poised to lead the group, again looking at value, momentum, and earnings. B) Top-Down Analysis of the Utility Sector In deciding whether to invest in certain utility stocks, it is critical to first look at how the overall sector stacks up relative to other sectors in value, momentum, and growth. The table below shows how the sector compares to other sectors in five valuation metrics that have been academically proven to predict returns: (click to enlarge) Source: QuantifiedAlpha.com The utilities sector looks the most attractive of any of the sectors on a book value basis, with the sector’s average price/book ratio of 2.22 being the lowest of any of the sectors. The sector looks relatively attractive on both a revenue and earnings basis, with a sales yield of 49% and earnings yield of 3.6%. Even with the big rally, the average utility stock pays a 3.4% dividend, good for third behind the Energy and Telecom sectors. Undervalued stocks tend to outperform the market, and using the average amount of excess return generated by these factors historically, our algorithms estimate how much. Overall, we expect the average utility stock to generate 1.31% of alpha attributable to value, over the next twelve months. Next, we analyze how the sector is doing on a growth & momentum basis: (click to enlarge) Source: QuantifiedAlpha.com As we said before, the utility sector has performed the best over the last twelve months, gaining 25% on average. It is the second best performing sector over the last six months, behind the Health Care sector, gaining a shade under 9%. The sector falls in the middle of the pack in average annual EPS growth, growing 18%. The sector is also in the middle of the pack in financial efficiency, returning an average of 2.8% on assets and 9.8% on equity. Each of these five metrics has been academically shown to predict stock returns, with the two price momentum metrics being the most important. Overall, we expect the average utility stock to generate 1.33% of alpha attributable to growth over the upcoming twelve months. C) Group Leaders Now that we’ve analyzed the sector on a top-down basis, we’ll now look at which stocks within the electric utility industry group look poised to lead the group. Below is a table showing which stocks in the group are the most undervalued: (click to enlarge) Source: QuantifiedAlpha.com As we can see, our top five most undervalued electrical utilities include Entergy Corporation (NYSE: ETR ), Exelon Corporation (NYSE: EXC ), Portland General Electric Company (NYSE: POR ), American Electric Power Co. (NYSE: AEP ), and Westar Energy (NYSE: WR ). Each of these companies has a sales yield (inverse of Price/Sales) over 45%, which is way above the overall market average. Each of these stocks sport similar earnings and dividend yields, each of which are again much higher than the overall market averages. These stocks also look attractive on a book value basis, with none of the company’s having a price/book ratio over 2. Overall, Entergy tops out as the value leader of the group, with our algorithms expecting the stock to generate 5.8% of value alpha over the next twelve months. With that being said, each of the five stocks is expected to significantly outperform the market due to their attractive value. Next, we’ll see which stocks are leading the sector in growth and momentum: (click to enlarge) Source: QuantifiedAlpha.com As we can see, our top five strongest growth electrical utilities include ITC Holdings Corp. (NYSE: ITC ), Hawaiian Electric Industries (NYSE: HE ), MGE Energy (NASDAQ: MGEE ), Northeast Utilities (NYSE: NU ), and Exelon Corporation. After a slow start to the year, Hawaiian has had a very strong second half of the year (+40%). Exelon has been the best performer over the past year, gaining 44%. Exelon has also had the strong EPS growth of the five, growing annual EPS by 41%. ITC Holdings tops the group in profit efficiency, returning 5.2% on assets and 21% on equity. Overall, ITC is expected to outperform the market the most owing to its growth profile over the upcoming twelve months (4.76%). Exelon is the only stock that made it onto both group leaders lists. Next, we’ll look at which stocks have been performing best relative analyst earnings expectations: (click to enlarge) Source: QuantifiedAlpha.com We’ve found through historical back testing that stocks that beat earnings estimates consistently, are extremely likely to keep beating estimates. This is crucial as stock prices can experience wild swings in price depending on how earnings come out relative to expectations. Hawaiian Electric has the best track record, having beaten EPS estimates by 12% last quarter (6 straight beats) and revenue estimates by 8% (2 straight beats). Edison International (NYSE: EIX ) has the best track record for EPS, having beaten the Wall Street consensus EPS estimates 8 times in a row. PPL Corporation (NYSE: PPL ), Westar Energy, and NextEra Energy (NYSE: NEE ) are names we haven’t seen yet, that have all outperformed expectations as well. D) Conclusion Now that we’ve analyzed the sector as a whole and the individual group leaders in the group, it is time to see which utility stock comes out on top. The table below shows the electric utility stocks we expect to outperform the market the most: (click to enlarge) Source: QuantifiedAlpha.com Exelon comes out on top on our list, with our algorithms expecting the stock to outperform the overall market by 8.73% over the next twelve months. Exelon combines strong value with solid momentum and EPS growth. Entergy, Hawaiian Electric, and Westar Energy are other stocks that were featured earlier in the article that also look very attractive. While American Electric Power is featured at #4 on our overall leader board, we advise investors to stay away from the stock as it has been missing analyst estimates recently (hence the one star Earnings Strength rating). Though the Utility sector outperformed the general market during 2014, we feel the sector is still relatively undervalued and certain names look very attractive.