Tag Archives: learn-more

Yellen’s Inflation Compensation And GLD
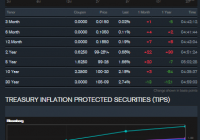
Summary The Fed is an important influencer of inflation, and for 2015, the Fed is ready to accept inflation as low as 1% and this will push down gold prices. The Fed is ready to fight possible long-term inflation as the economy grows by raising Fed Rates and gradually reducing its $4.55 trillion balance sheet if necessary. Yellen is signaling that the Fed is going to ignore market based weak inflation expectations as seen by the new term ‘inflation compensation’ on the Treasury market. Slim possibility that inflation will overshoot the 2% target, it is more likely to undershoot as energy prices are not transitory. A significant portion of gold holders still see high inflation as the economy strengthens. This is not applicable now and it is time to sell GLD before the crowd does. Fed, Inflation and Gold Frequent readers of my articles on gold will realize that I have been bearish on gold for quite some time now. Gold has many purposes and one of which is for its usage as storage of value. There will always be someone who is willing to buy and store gold if they do not believe in today’s monetary order or simply to form part of a diversified portfolio, and there are those who buy gold as an inflation hedge. This article is targeted for those who view gold as an inflation hedge. There will be a significant portion of investors who will buy gold as an inflation hedge, and it is the changes in inflation or inflation expectations which will have a big impact on the price of gold. There is no other institution that has more influence on inflation than the Federal Reserve, and this is why I believe that by following the Fed closely, we can better inform ourselves on inflation and that is why most of my gold article involves the Fed in one way or the other. The latest Fed document comes in the form of Chair Janet Yellen’s press conference on 17 December 2014. As always, the mainstream media is obsessed with when the Fed will raise interest rates, and there are a number of questions on it with the word ‘patient’ being the new buzz word. If you read the press articles elsewhere, you will probably be informed that the Fed will not raise rates for ‘a couple’ of meetings. Indeed, during the question and answer session, one reporter even wanted to confirm with the Chair if ‘a couple’ means 2 meetings which was subsequently confirmed. However, this is actually quite meaningless for the serious investors because Yellen has qualified her response as data dependent so who is to stop her from raising rates in the next meeting or 5 meetings down the road? She has certainly kept that possibility open, and remember that the US grew by 5% in the third quarter of 2014. My article may have come after all the buzz has subsided, but as you read about it in the new year of 2015, I hope to bring about new perspective based on some points that are largely ignored by the media. Let me bring your attention to the idea of inflation compensation, the existing size of the Fed’s balance sheet, and the Fed’s own inflation expectation for 2015, together with their view of a transitory low energy prices. Rate Hikes and Balance Sheet – Tools ready to Cap Growth Related Inflation Let us first begin with the concept that monetary policy works with a lag time. So the appropriate response to do is to predict as best as possible what will happen in the future and set policy that will ensure that the Fed’s dual mandate of stable prices and maximum employment is achieved as much as possible when the monetary policy takes effect. The Fed views that stable price means a 2% inflation target and predicts that this will be reached in 2017. Stable prices can only be achieved together with an appropriate Federal Funds Rate, which stands at 3.75% in the long run. However, the Fed set a target of 2.5% by 2017 to accommodate for the economic recovery and deal with the residual effect of the Great Recession. This will fit into the narrative where they would start to raise rates in 2015 and gradually guide rates towards their target as they expect the economy to grow in strength. For the shorter term, the Fed’s own forecast, which they would have factored in their own rate hikes, expects inflation to stay between 1% to 1.6% in 2015. This range is within the current Personal Consumption Expenditure inflation reading of 1.4% . So at least in the short term, the Fed is willing to accept lower inflation reading and this is going to be bearish on gold. However, gold might still catch a bid if there is a reasonable expectation for inflation to increase significantly in the future. This is where the size of the Fed balance sheet comes into the picture and where the uncertainty over the inflation compensation comes into play. The Fed is holding $4.55 trillion of assets as of 24 December 2014 and $4.47 trillion comes in the form of Federal Reserve credit. While this may have been accommodative in the past, it can also be used to keep a lid on inflation as seen in the quote by Yellen below. “Rather than actively planning to sell the assets that we’ve put onto our balance sheet, sometime after we begin raising our targets for short-term interest rates, depending on economic and financial conditions, we’re likely to reduce or cease reinvestment and gradually run down the stock of our assets. But our active tool for adjusting monetary – the stance of monetary policy so that it is appropriate for the economic needs for the country, that will be done through adjusting our short-term target range for the federal funds rate.” Yellen’s quote above shows that the Fed is ready to tighten monetary policy not only through the federal rate hike that is in the spotlight recently, but also through a gradual reduction of its balance sheet assets. Hence, we can conclude that the Fed is poised to reign in any runaway inflation that they expect when the economy recovers. This is an old economic theory that is about to be revisited by the investment community at large. Also, consider the argument that low energy prices may be here to stay in this excellent article by Kyle Spencer. The Fed has a bullish outlook for the US economy, and this is the majority view of the FOMC and they are prepared to reign in long-term inflation. The biggest cheerleader of them all has to be the Dallas Fed President, and you can read all about it in this article, Dallas Fed Fisher’s Prescience And GLD . In that article, I gave you the reason that the USD will rise, as the strong 5% GDP growth reinforces the possibility of an earlier rate hike and this will bring down the price of gold that is denominated in USD. In this article, I am now giving you another reason to sell which is to say that the Fed has capped all possibilities of inflation going higher than 2%. In all possibilities, inflation is more included to remain lower than what the Fed expects. My view is that the economy may grow, but inflation might not move towards the 2% target that is expected by the Fed. The tightening of monetary conditions by way of rate hikes will act as an inflation dampener in 2017. I have written about it in this article, Growflation And The 1% Fed Inflation Target In 2015 so I am not going to repeat myself. I am going to bring a new perspective of the declining yield of the 5-year treasury yields and how the Fed is responding to it. Instead of seeing it as a sign of a decline in inflation expectations, they see that it is possible that this could be due to an influx of funds due to the USD safe haven status. Inflation Compensation “Well, what I would say, we refer to this in the statement as “inflation compensation” rather than “inflation expectations.” The gap between the nominal yields on 10-year Treasuries, for example, and TIPS have declined-that’s inflation compensation. And five-year, five-year-forwards,as you’ve said, have also declined. That could reflect a change in inflation expectations, but it could also reflect changes in assessment of inflation risks. The risk premium that’s necessary to compensate for inflation, that might especially have fallen if the probabilities attached to very high inflation have come down. And it can also reflect liquidity effects in markets. And, for example, it’s sometimes the case that-when there is a flight to safety, that flight tends to be concentrated in nominal Treasuries and could also serve to compress that spread. So I think the jury is out about exactly how to interpret that downward move in inflation compensation. And we indicated that we are monitoring inflation developments carefully.” I have quoted Yellen on her answer above as this is a new concept. This would imply that the Fed would not take reference from market signals as credible inflation measurement for a while. This is evident in Yellen’s renaming of inflation expectation to inflation compensation instead. In other words, investors may expect 2% inflation in 5 years time, but increased demand for Treasury bills pushed down their actual yield to 1.538% (Current Yield of 1.66%-0.125% TIPS, see chart below). Hence, this 1.538% inflation market expectation is not a good gauge of actual inflation 5 years later. Source: Bloomberg This safe haven argument is not an unreasonable one, as Europe and Japan are still mired in economic troubles. Europe, Japan and Switzerland have all instituted negative interest rates, and it is only logical that international capital would flee these financial centers and enter into secure Treasury holdings, especially when the market has reasonable expectations that rates are going to rise soon. So to summarize it even further, Yellen is telling the world that the Treasury inflation pricing mechanism is malfunctioning now so don’t take it seriously. Since the Fed is going to raise rates soon, the danger is not that it would overshoot its inflation target, but rather that it will undershoot the inflation target. This is why I am bearish on gold as there is little upside to inflation to support gold prices. As long as the market continues its expectation that inflation is coming as the economy recovers, they will continue to overprice gold as there will be investors who will hold gold with a longer time horizon. Profiting with GLD In other words, there is a very slim possibility of high inflation in the days ahead, and the greater possibility is that inflation will undershoot the 2% target in the medium term. Hence, there is no reason to hold gold as an inflation hedge. As the new consensus builds around this, gold prices will continue its secular decline. The way for investors to profit from this is to sell the SPDR Gold Trust ETF (NYSEARCA: GLD ). There are other gold ETFs, but GLD is the most liquid at $27.45 billion market capitalization and 7.9 million of last known daily transaction. (click to enlarge) As you can see on the chart above, GLD has been on the bearish decline, but periodically there will be strength for which investors can sell on. This is indicative of a healthy market for which to sell GLD. The pullback indicates the profit taking of the bears. Of course, this bearishness of GLD will end one day as it approaches its true value. However, this will only happen after we see the significant portion of gold holders who hold in expectation of higher inflation as the economy grows give up their position. For most, this will only occur when they continue to see low inflation amid high growth. Then they will question themselves why they are willing to lose out on the economic growth by tying up their funds on their gold holding when there is very low inflation. So for readers who hold gold as an inflation hedge and are persuaded by my arguments, the time to sell gold is now before a flood of sell orders enter the market.
In Defense Of iShares MSCI Emerging Markets Minimum Volatility ETF

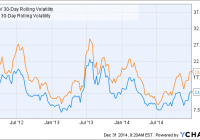
Summary I recently profiled several emerging market low-volatility ETFs and selected EEMV for my own personal portfolio. Last year, another Seeking Alpha author wrote a detailed analysis highlighting the drawbacks of EEMV. This piece considers those drawbacks in light of EEMV’s 3-year performance and also examines the role of the fund in one’s portfolio. Introduction In a previous article , we studied the performance of three low-volatility emerging market (EM) ETFs: EGShares Low Volatility EM Dividend ETF (NYSEARCA: HILO ), PowerShares S&P Emerging Markets Low Volatility Portfolio (NYSEARCA: EELV ) and iShares MSCI Emerging Markets Minimum Volatility (NYSEARCA: EEMV ). We found that all three low-volatility EM ETFs delivered lower volatility than the benchmark iShares MSCI Emerging Markets ETF (NYSEARCA: EEM ) over the past two years, but with wildly disparate returns. EEMV did the best out of the three funds, with a 20.64% return, while EELV returned 8.87%. Also, both funds beat EEM (6.23%). On the other hand, HILO was by far the worst fund with a total return performance of -9.53%. I decided to select EEMV for my own portfolio as it had better sector diversification, greater allocation towards low P/E countries, and the lowest expense ratio out of all the ETFs. In April 2013, around one and a half years after the inception of EEMV, Seeking Alpha author Investment Therapist wrote a detailed analysis that was critical of EEMV for the following four reasons: The methodology of EEMV is constructed without a return focus. Historical volatility is not the best way to obtain low future volatility. EEMV is underdiversified and overconcentrated in low-volatility, high-dividend names, which may underperform in a bull market. The low volatility of EEMV will not protect the fund from a financial crisis. With another 1.5 years under its belt since the date of that article, this fund is now over three years old. This article seeks to address some of the criticisms raised by Investment Therapist in light of the EEMV’s three year performance, and also examines the role of the fund in one’s portfolio. While I disagree with some of his statements, this piece aims not to be combative, but is intended to both clarify my own thinking and to stimulate discussion with the broad readership of Seeking Alpha. 1. The methodology of EEMV is constructed without a return focus. Investment Therapist writes: Basically, the portfolio is being created with an emphasis on volatility and NOT return opportunities. It should go without saying that most rational investors are primarily focused on potential Rewards relative to Risk, and not solely focused on Risk (volatility). By focusing on volatility, the portfolio is created with no outlook on the future return opportunities of the stocks within the portfolio. Investment Therapist is basically saying that volatility has no relationship with future return. However, volatility is a validated factor for alpha. In an April 2012 article by Robeco Asset Management entitled “The volatility effect in emerging markets”, authors Blitz, Pang and Vliet found that from 1988 to 2010, EM stocks that showed lower volatility or lower beta outperformed those with higher volatility or higher beta on a risk-adjusted basis. After adjusting for differences in market beta, the “top-minus-bottom” 1-factor alpha spread between the highest and lowest quintiles of stocks ranked in terms of volatility was determined to be -8.8% per annum. Ranking stocks in terms of beta produced similar results that were less strong (1-factor alpha spread = -5.4%), but still statistically significant. Similar analysis conducted with size, value and momentum (re)confirmed that these premia also operated in emerging markets. Based on the 1-factor alphas, the authors found that the low-volatility premium was much larger than the size premium, comparable to the value premium, but smaller than the momentum premium. Low-volatility stocks also tend to be larger and more mature companies, which could possibly predispose them towards value rather than growth exposure. Was the low volatility premium simply due to an increased exposure to the value factor? To address this, the authors calculated 3-factor and 4-factor alphas for their sample. They found that the 3-factor alphas were very similar to the 1-factor alphas, indicating that exposures to size or value do not explain the higher returns of low-volatility or low-beta stocks in the study. Only the 4-factor alphas were slightly lower, indicating that low-volatility stocks may have indirectly benefited by also showing momentum characteristics (NB: riddle me that!). Therefore, it seems that selecting for low-volatility has been a robust factor for achieving higher risk-adjusted returns. 2. Historical volatility is not the best way to obtain low future volatility. In Robeco’s study of emerging market stocks, the authors stated that “Past risk is again strongly predictive for future risk”. However, Investment Therapist writes: If choosing stocks with low historical volatility and/or low correlations is such a great way of creating a “Minimum Volatility Portfolio,” then why are there over 10 Emerging Market mutual funds that have lower 1-year and Since Inception (of EEMV) volatility than EEMV? Focusing on historical volatility clearly doesn’t produce a portfolio with the lowest volatility. The funds with lower volatility than EEMV focus on the valuation of stocks (determining a stock’s intrinsic value), which EEMV does not since returns are not an input into the construction of the ETF portfolio. Investment Therapist is saying that funds (presumably mutual funds) with a focus on value managed to achieve lower volatility than EEMV over 1-year or since inception (1.5 years). As EEMV is now 3 years old, we can do a longer test of its realized volatility. Note that I shall be using EEM as a benchmark rather than mutual funds as I believe that is a fairer comparison. The graph below shows the 30-day volatility for EEMV and EEM over the past 3 years. EEMV 30-Day Rolling Volatility data by YCharts The results show that EEMV has consistently managed to obtain lower volatility than EEM over the past 3 years. Therefore, it seems that the fund does succeed at producing lower volatility compared to the benchmark. Just for interest, I also report the 2-year volatility and beta values for three EM low-volatility funds (EEMV, EELV and HILO), three EM value funds ( EVAL , PXH , TLTE ), and EEM. The 2-year return of the funds is also shown for comparison. Data are from InvestSpy . Volatility Beta Return EEMV 12.90% 0.81 3.90% EELV 13.30% 0.81 -2.00% HILO 15.30% 0.89 -15.90% Average 13.83% 0.84 -4.67% (NASDAQ: EVAL ) 25.00% 0.57 -5.20% (NYSEARCA: PXH ) 17.90% 1.06 -9.30% (NYSEARCA: TLTE ) 14.70% 0.82 -1.60% Average 19.20% 0.82 -5.37% EEM 16.90% 1.06 -1.40% Interestingly, we find that the three EM value funds actually had higher volatility than the benchmark EEM. Therefore, for passively-managed emerging markets ETFs at least, it seems that value stocks did not possess lower volatilities. 3. EEMV is underdiversified and overconcentrated in low-volatility, high-dividend names, which may underperform in a bull market. Investment Therapist writes: With correlations now coming down and higher yielding investments now approaching the status of “overcrowded trade,” I expect (my opinion) that the same high tracking error that came with the fund on the upside performance will also cause this fund to experience strong pains should a bull market in Emerging Markets form. Overall, once the strong performance over the fund’s very short tenure is examined deeper, it can be seen that the strong stylized bias towards the value-oriented, low-volatility names were a tail-wind to the fund. I do agree with Investment Therapist here. Low-volatility names tend to exist in more mature, stable industries that have a lower capacity for growth. In our previous article, we saw that EEMV was actually more pricey than EEM in terms of its valuation metrics (table reproduced below, data from Morningstar , value metrics are forward-looking). EEMV EEM Price/Earnings 15.69 12.76 Price/Book 1.86 1.49 Price/Sales 1.51 1.14 Price/Cash Flow 7.38 4.91 Dividend yield % 2.81 2.56 Projected Earnings Growth % 10.97 11.76 Historical Earnings Growth % 5.06 -1.68 Sales Growth % -15.60 -13.79 Cash-flow Growth % 6.36 7.85 Book-value Growth % -26.56 -21.57 Since EEMV’s inception, there have been at least two mini-bull markets where EEM climbed by 20% or more. Let’s see how EEMV and its “opposite fund”, the PowerShares S&P Emerging Markets High Beta Portfolio (NYSEARCA: EEHB ), performed over these two time periods. Jun 1st, 2012 to Jan 1st, 2013 EEM Total Return Price data by YCharts Feb 1st, 2014 to Sep 1st, 2014 EEM Total Return Price data by YCharts We can see that in both mini-bull runs, EEMV underperformed the benchmark EEM, while EEHB outperformed. Therefore, I agree with Investment Therapist’s assertion that EEMV would likely underperform EEM in a future bull market. But we should also consider this question: what was the purpose of the low-volatility fund in the first place? No one should have expected such a fund to keep pace with a roaring bull. Instead, a low-volatility fund’s aim should be to reduce equity risk (to a certain extent), resulting in higher risk-adjusted returns. The following table shows the 20-month return, volatility, beta, and maximum drawdown of EEMV, EEHB and EEM (data from InvestSpy ). Volatility Beta Max draw. Return EEMV 13.7% 0.86 -15.90% 7.80% EEHB 25.0% 0.62 -29.90% -12.90% EEM 18.0% 1.16 -18.90% -5.60% We can see that the recent struggles of EM markets has caused EEHB to significantly underperform. EEHB had higher volatility and also greater maximum drawdown over the past 20 months compared to EEMV or EEM. (Note that the beta values are with respect to S&P500 and therefore may n to be applicable). So am I saying to go for high volatility/beta in bull markets, and low volatility/beta in bear markets? Hardly. The first reason is that no one can reliably predict when the next bull or bear market will arrive. The second reason is that if you were to pick a factor to tilt towards in a bull market, wouldn’t you rather choose momentum [such as PowerShares DWA Emerging Market Momentum Portfolio (NYSEARCA: PIE )], which is an academically validated factor for outperformance, rather than high-volatility, an academically validated factor for underperformance? All in all, I don’t think that buying-and-holding EEMV is an inherently flawed decision. This is particularly true for the investor who wants some exposure to emerging markets, but are afraid that they can’t handle the higher volatility of emerging markets. However, for investors with a higher risk tolerance I would recommend also buying PIE and PXH to take advantage of momentum and value premia as well, and for better diversification over the entire market cycle (one could also achieve better diversification by holding EEM). 4. The low volatility of EEMV will not protect the fund from a financial crisis. Investment Therapist writes: Bonds will behave much differently than stocks, even during a financial crisis. A portfolio of stocks, however, wavered during the most recent financial crisis and the lack of “diversification” was made evident. There is no fundamental research proving that this type of optimization would work at the Stock Selection level since a portfolio of stocks behave more similarly than two unique strategies like Bonds and Stocks. I do completely agree with Investment Therapist on this. Low volatility stocks are still stocks, and will move (more or less) as other stocks do. Therefore, investors in EEMV should not expect the fund to hold up during a recession (like a bond would). But again, an investor should be asking the same question: what was the purpose of the low-volatility fund in the first place? What a low-volatility fund will do is to perform better than a neutral or a high-volatility fund during a correction or a bear market. Indeed, (backtested) data shows that MSCI EM Minimum Volatility Index, the underlying index for EEMV, dropped “only” -41.97% in 2008, while the MSCI EM index dropped -53.18%. In more recent and actual data, EEMV held up better than EEM in the September swoon that hit emerging markets this year (strangely, so did EEHB). EEM Total Return Price data by YCharts Conclusion Investment Therapist’s article contained some criticisms on EEMV that, while technically correct, should not unduly worry the investor who recognizes the role and limitations of a low-volatility fund in their portfolio. Yes, EEMV will likely underperform EEM in a bull market and will also likely underperform bonds during a bear market. However, what EEMV will deliver is lower volatility compared to EEM, which is great from a psychological point of view, as well as higher risk-adjusted returns or “alpha” (as long as the low-volatility premium persists, which I will assume to be the case until evidence points otherwise). However, one cautionary note that I will echo Investment Therapist on is that low-volatility stocks are becoming more expensive. Therefore, I recommend that investors with higher risk tolerances should also consider holding EM value funds such as PXH or EM momentum funds such as PIE to harvest other alternative sources of alpha.

Pigs In China – A Longer-Term Reason To Like Corn

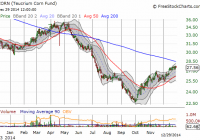
The Teucrium Corn ETF finally seems to be bottoming although technical challenges remain overhead at the 200-day moving average. China’s massive consumption of pig meat creates tremendous demand for imported soy beans and corn to feed these pigs. Assuming this demand for pigs is sustainable, it promises to support corn prices, and thus dip-buying in Teucrium Corn ETF, over the longer-term. After an additional dip, my thesis for playing another bottom in Teucrium Corn ETF (NYSEARCA: CORN ) seems to finally be working. Since that article in mid-August, CORN is up 5.3% versus a 6.0% gain in the S&P 500 (NYSEARCA: SPY ). However, on the way to this gain, CORN first lost as much as 13%…so the ETF has a lot of work to do to balance out risk and reward. The next challenge for Teucrium Corn ETF : a downtrending 200-day moving average (DMA) Source: FreeStockCharts.com As I continue to patiently wait for this trade to unfold, I occasionally check in on relevant news to support or refute the thesis of a supply correction coupled with on-going strength in demand. One of the more fascinating pieces I have read along these lines comes from the Economist on December 20, 2014 titled ” Swine in China: Empire of the pig .” Before reading this piece, I had almost no understanding of the pig’s importance in Chinese history and diet. China’s increase in wealth in recent decades has simultaneously encouraged a massive increase in the consumption of pig meat: Since the late 1970s, when the government liberalised agriculture, pork consumption has increased nearly sevenfold in China. It now produces and consumes almost 500m swine a year, half of all the pigs in the world. This increase has brought a whole host of challenges to China’s government, farmers, and society as a whole. There are even environmental threats reaching into other countries. Since pig feed mainly consists of soy beans and corn (food scraps off the family table have long ceased being sufficient!), China’s demand for these crops has soared along with pig consumption. China cannot feed all its pigs and thus relies on imports. The International Institute of Social Studies in The Hague estimates… …more than half of the world’s feed crops will soon be eaten by Chinese pigs. Already in 2010 China’s soy imports accounted for more than 50% of the total global soy market. The kicker for corn comes from the trade organization, the US Grains Council: …by 2022 China will need to import 19m-32m tonnes of corn. That equates to between a fifth and a third of the world’s entire trade in corn today. China’s need for pig feed is so great that the International Institute for Sustainable Development claims China has (discreetly) purchased 5m hectares in developing countries for farming purposes. The Economist notes that, when Shuanghui, China’s largest pork producer, bought Smithfield Foods, an American firm, in 2013, it acquired huge stretches of Missouri and Texas. While the sustainability of China’s pig consumption is far from clear, it appears that China will imminently help pressure corn markets over the long-term. Along with this strength comes support for prices over time – the kind of support that makes dip-buying particularly attractive. The China/pig factor provides additional (and important) context to the on-going insistence from Deere’s CEO that corn prices will come back. Be careful out there!