Tag Archives: learn-more

iPath Natural Gas ETN Is A Broken Product

ETF and ETN investors should avoid broken products. I have repeated this caution numerous times over the years. Upon hearing this warning, most investors want to know what a broken product is. Once they understand the definition, they quickly grasp the danger. ETFs and ETNs are unique securities. The primary feature that differentiates them from other investment vehicles is the ability to create and redeem shares, typically through an in-kind exchange process. Another key feature is the publishing of the underlying portfolio’s value throughout the trading day. The two features combined allow market makers to keep the trading price very close to the value (often called the Intraday Value or the iNAV). This is the “promise” behind ETFs and ETNs, and investors expect these products to live up to it. However, sometimes the share creation mechanism is suspended or terminated for a given product, and that is when it becomes a broken product. Without a viable share creation process, an ETF or ETN can trade like a closed-end fund with price premiums. The typical retail investor does not have an easy way of knowing if a product is broken or not, and that is where the danger lies. It could be trading at a substantial premium, a premium that could disappear instantly. This is not just a theoretical problem; it is very real and happening today. You are probably aware that crude oil prices have been falling for a number of months. More recently, natural gas prices plunged. ETFs and ETNs tracking natural gas fell right along with the underlying commodity. Last week, the United States Natural Gas Fund (NYSEARCA: UNG ) dropped 12.5%. The leveraged ProShares Ultra Bloomberg Natural Gas ETF (NYSEARCA: BOIL ) was whacked for a 22.6% loss. However, the iPath DJ-UBS Natural Gas Total Return Sub-Index ETN (NYSEARCA: GAZ ), an unleveraged product tracking the same index as BOIL, gained 5.9%. The reason for this is because GAZ is a broken product. On August 21, 2009, Barclays “temporarily suspended” the creation unit process for GAZ . More than five years later it is still suspended, straining the credibility of the word temporarily. I’m willing to bet most investors are unaware GAZ is broken. Without the ability to create and redeem units of GAZ, it is impossible for market makers to keep the trading price near the net asset value (“NAV”). The NAV of GAZ went from $1.9182 to $1.5874 per unit last week, a plunge of 17.2%. The price went the other way, increasing from $2.02 to $2.14. GAZ started the week trading at a 5.3% premium and closed with a 34.8% premium. The premium narrowed slightly earlier this week, but it was more than 36% at the close on Wednesday. Anyone buying GAZ today is far more than it is worth. This is not a traditional liquidity problem, as GAZ has averaged more than 100,000 shares a day recently. This high volume suggests that many participants are unaware of its broken product status. One day, regulators may require investors be informed they are buying a broken product by requiring a ticker symbol suffix or some other means. Until then, be careful out there, and don’t get caught owning a broken product when the premium disappears . Disclosure covering writer, editor, and publisher: No positions in any of the securities mentioned. No positions in any of the companies or ETF sponsors mentioned. No income, revenue, or other compensation (either directly or indirectly) received from, or on behalf of, any of the companies or ETF sponsors mentioned.

EELV Makes The Cut For Consideration, May Be A Good Option For Emerging Market Exposure

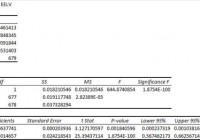
Summary I’m taking a look at EELV as a candidate for inclusion in my ETF portfolio. The expense ratio is a little high relative to my cheap tastes, but certainly within reason. The correlation to SPY is low and based on reasonable trade volumes. Returns since inception have been fairly weak, but the measuring period is less than 3 years. The ETF might fit for my portfolio. I’m not assessing any tax impacts. Investors should check their own situation for tax exposure. Investors should be seeking to improve their risk adjusted returns. I’m a big fan of using ETFs to achieve the risk adjusted returns relative to the portfolios that a normal investor can generate for themselves after trading costs. I’m working on building a new portfolio and I’m going to be analyzing several of the ETFs that I am considering for my personal portfolio. One of the funds that I’m considering is the PowerShares S&P Emerging Markets Low Volatility Portfolio (NYSEARCA: EELV ). I’ll be performing a substantial portion of my analysis along the lines of modern portfolio theory, so my goal is to find ways to minimize costs while achieving diversification to reduce my risk level. What does EELV do? EELV attempts to track the total return (before fees and expenses) of the S&P BMI Emerging Markets Low Volatility Index. At least 90% of the assets are invested in funds included in this index. EELV falls under the category of “Diversified Emerging Markets”. Does EELV provide diversification benefits to a portfolio? Each investor may hold a different portfolio, but I use SPY as the basis for my analysis. I believe SPY, or another large cap U.S. fund with similar properties, represents the reasonable first step for many investors designing an ETF portfolio. Therefore, I start my diversification analysis by seeing how it works with SPY. I start with an ANOVA table: (click to enlarge) The correlation is excellent at 70%. I want to see low correlations on my international investments. Extremely low levels of correlation are wonderful for establishing a more stable portfolio. I consider anything under 50% to be extremely low. However, for equity securities an extremely low correlation is frequently only found when there are substantial issues with trading volumes that may distort the statistics. Standard deviation of daily returns (dividend adjusted, measured since April 2012) The standard deviation is a bit high. For EELV it is .8427%. For SPY, it is 0.7420% for the same period. SPY usually beats other ETFs in this regard, so I’m not too concerned about this. Because the ETF has fairly low correlation for equity investments and an acceptable standard deviation of returns, it should do fairly well under modern portfolio theory. Liquidity looks fine Average trading volume isn’t very high, just shy of 60,000, but that isn’t low enough to be a major concern for me. Mixing it with SPY I also run comparisons on the standard deviation of daily returns for the portfolio assuming that the portfolio is combined with the S&P 500. For research, I assume daily rebalancing because it dramatically simplifies the math. With a 50/50 weighting in a portfolio holding only SPY and EELV, the standard deviation of daily returns across the entire portfolio is 0.7304%. With 80% in SPY and 20% in EELV, the standard deviation of the portfolio would have been .7215%. If an investor wanted to use EELV as a supplement to their portfolio, the standard deviation across the portfolio with 95% in SPY and 5% in EELV would have been .7349%. I know it may seem weird that the standard deviation is lowest at the middle level of including EELV, but that is normal for an asset with low correlation but higher standard deviation. Why I use standard deviation of daily returns I don’t believe historical returns have predictive power for future returns, but I do believe historical values for standard deviations of returns relative to other ETFs have some predictive power on future risks and correlations. Yield & Taxes The distribution yield is 2.68%. That appears to be a respectable yield. This ETF could be worth considering for retiring investors. I like to see strong yields for retiring portfolios because I don’t want to touch the principal. By investing in ETFs I’m removing some of the human emotions, such as panic. Higher yields imply lower growth rates (without reinvestment) over the long term, but that is an acceptable trade off in my opinion. I’m not a CPA or CFP, so I’m not assessing any tax impacts. Expense Ratio The ETF is posting .45% for a gross expense ratio, and .29% for a net expense ratio. I want diversification, I want stability, and I don’t want to pay for them. The expense ratio on this fund is higher than I want to pay for equity securities, but not high enough to make me eliminate it from consideration. I view expense ratios as a very important part of the long-term return picture because I want to hold the ETF for a time period measured in decades. Market to NAV The ETF is at a -.47% discount to NAV currently. Premiums or discounts to NAV can change very quickly so investors should check prior to putting in an order. The ETF is large enough and liquid enough that I would expect the ETF to stay fairly close to NAV. Generally, I don’t trust deviations from NAV. If I can buy an ETF at a discount to NAV, I consider that to be a favorable entry price. Largest Holdings The diversification is very good in this ETF. If I’m going to be stuck with that expense ratio, I expect it to buy a fairly strong level of diversification. This ETF is providing a good level of diversification to give some justification to the expense ratio. (click to enlarge) Conclusion I’m currently screening a large volume of ETFs for my own portfolio. The portfolio I’m building is through Schwab, so I’m able to trade EELV with no commissions. I have a strong preference for researching ETFs that are free to trade in my account, so most of my research will be on ETFs that fall under the “ETF OneSource” program. The correlation and diversification are great. The discount to NAV is also very appealing, but those discounts can disappear quickly. The net expense ratio isn’t too bad, though the gross expense ratio is less attractive. I might dig into the difference if I was considering a large position to determine how sustainable it would be. Since the ETF is covering emerging markets, I wouldn’t want to go more than 10% into the ETF because of the risks that I believe are present there. On the other hand, we saw that the portfolio had a lower standard deviation when this ETF was 20% of the portfolio rather than 5% because of the low correlation. I’ll need to test EELV in hypothetical portfolios that are more diversified to see how it does there. I think this one is worth considering for the 5% to 10% exposure to emerging markets. Additional disclosure: Information in this article represents the opinion of the analyst. All statements are represented as opinions, rather than facts, and should not be construed as advice to buy or sell a security. Ratings of “outperform” and “underperform” reflect the analyst’s estimation of a divergence between the market value for a security and the price that would be appropriate given the potential for risks and returns relative to other securities. The analyst does not know your particular objectives for returns or constraints upon investing. All investors are encouraged to do their own research before making any investment decision. Information is regularly obtained from Yahoo Finance, Google Finance, and SEC Database. If Yahoo, Google, or the SEC database contained faulty or old information it could be incorporated into my analysis. The analyst holds a diversified portfolio including mutual funds or index funds which may include a small long exposure to the stock.

I Like The Risk Level On SPLV, But I’m Not Entirely Sold

Summary I’m taking a look at SPLV as a candidate for inclusion in my ETF portfolio. I’m not huge on the expense ratio, but I like the other aspects of the ETF. The ETF is incredibly well-diversified which favorably impacts the standard deviation of returns. In the context of Modern Portfolio, the correlation and standard deviation of returns are very important. The ETF looks favorable in those regards. I’m not assessing any tax impacts. Investors should check their own situation for tax exposure. Investors should be seeking to improve their risk adjusted returns. I’m a big fan of using ETFs to achieve the risk adjusted returns relative to the portfolios that a normal investor can generate for themselves after trading costs. I’m working on building a new portfolio, and I’m going to be analyzing several of the ETFs that I am considering for my personal portfolio. One of the funds that I’m considering is the PowerShares S&P 500 Low Volatility Portfolio (NYSEARCA: SPLV ). I’ll be performing a substantial portion of my analysis along the lines of modern portfolio theory, so my goal is to find ways to minimize costs while achieving diversification to reduce my risk level. What does SPLV do? SPLV attempts to track the total return of the S&P 500® Low Volatility Index. At least 90% of funds are invested in companies that are part of the index. SPLV falls under the category of “Large Value.” Does SPLV provide diversification benefits to a portfolio? Each investor may hold a different portfolio, but I use (NYSEARCA: SPY ) as the basis for my analysis. I believe SPY, or another large cap U.S. fund with similar properties, represents the reasonable first step for many investors designing an ETF portfolio. Therefore, I start my diversification analysis by seeing how it works with SPY. I start with an ANOVA table: (click to enlarge) The correlation is about 86%. This is pretty great for making the ETF fit under modern portfolio theory. The low correlation means it should be possible to use the ETF without raising the standard deviation of returns unless the risk ETF has a very high standard of deviation of returns. Standard deviation of daily returns (dividend adjusted, measured since January 2012) The standard deviation is phenomenal. For SPLV it is .5978%. For SPY, it is 0.7300% for the same period. SPY usually beats other ETFs in this regard, so the combination of reasonable correlation and lower standard deviation than SPY is giving this ETF a real chance at being selected for my portfolio. Mixing it with SPY I also run comparisons on the standard deviation of daily returns for the portfolio assuming that the portfolio is combined with the S&P 500. For research, I assume daily rebalancing because it dramatically simplifies the math. With a 50/50 weighting in a portfolio holding only SPY and SPLV, the standard deviation of daily returns across the entire portfolio is 0.6410%. If we drop the position to 20% the standard deviation goes to .6899%. Once we drop it down to a 5% position the standard deviation is .7195%. I haven’t decided what exposure level I would use yet, but probably 5% to 10%. I really like the combination of low volatility and moderate to low correlation. If it wasn’t for the higher expense ratio, I’d consider making this a core holding. Why I use standard deviation of daily returns I don’t believe historical returns have predictive power for future returns, but I do believe historical values for standard deviations of returns relative to other ETFs have some predictive power on future risks and correlations. Yield & Taxes The distribution yield is 2.21%. The yield seems strong enough that it could be included in a retirees portfolio to bring some diversification benefits and a moderate dividend yield. I’m not a CPA or CFP, so I’m not assessing any tax impacts. If I were using SPLV, I would want it to be in a tax exempt account to remove any headaches associated with frequent rebalancing. Expense Ratio The ETF is posting .25% for an expense ratio. I want diversification, I want stability, and I don’t want to pay for them. In my opinion, a .25% expense ratio is higher than I want to pay for equity investments. It’s still low relative to many other methods of investing, but I’m looking for long term holdings and I don’t want to give my investments away. I haven’t decided if it’s worth paying the higher expense ratio to include SPLV. If the expense ratio was under .10%, this ETF would have a very strong case for being included. Market to NAV The ETF is at a .05% premium to NAV currently. In my opinion, that’s not worth worrying about. It is practically trading right on top of NAV. However, premiums or discounts to NAV can change very quickly so investors should check prior to putting in an order. Largest Holdings The portfolio is extremely well diversified. The largest position is around 1.25% of the portfolio. That is solid diversification. The intense diversification is part of the reason the volatility of the ETF is so low. Check out the chart below: (click to enlarge) Conclusion I’m currently screening a large volume of ETFs for my own portfolio. The portfolio I’m building is through Schwab, so I’m able to trade SPLV with no commissions. I have a strong preference for researching ETFs that are free to trade in my account, so most of my research will be on ETFs that fall under the “ETF OneSource” program. SPLV is a difficult ETF to make a decision on. For equity investments, the expense ratio is a bit high, but the relatively low correlation and standard deviation of returns make a pretty good argument for using at least a small position such as 5% in a long term portfolio. I could go either way on this one. I won’t consider it as a core holding (20%+) because of the higher expense ratio. Disclaimer: Information in this article represents the opinion of the analyst. All statements are represented as opinions, rather than facts, and should not be construed as advice to buy or sell a security. Ratings of “outperform” and “underperform” reflect the analyst’s estimation of a divergence between the market value for a security and the price that would be appropriate given the potential for risks and returns relative to other securities. The analyst does not know your particular objectives for returns or constraints upon investing. All investors are encouraged to do their own research before making any investment decision. Information is regularly obtained from Yahoo Finance, Google Finance, and SEC Database. If Yahoo, Google, or the SEC database contained faulty or old information it could be incorporated into my analysis. The analyst holds a diversified portfolio including mutual funds or index funds which may include a small long exposure to the stock.