Tag Archives: investing ideas

Value Or Momentum? Try Both
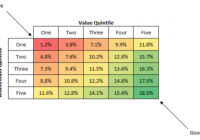
Let’s go back in time 30 years. Remember those “Taste great/less filling” Miller Lite beer commercials from the mid-1980s? You could roughly divide the world’s beer-drinking population into two rival factions: Those that insisted that Miller Lite tasted great… and those that insisted it was less filling. I believe many men lost their lives fighting over this in bars. And I suppose as far as causes go, it’s as good of a cause as any to die for. I consider Miller Lite to neither taste particularly great nor be particularly easy on my stomach. As a native Texan, my heart will always belong to Shiner Bock. But I digress. We’re not here today to discuss beer dogmatism but the far more practical world of investing. As with Miller Lite fans, you can roughly divide the investing world into two camps: Those who favor value strategies and those that favor momentum strategies. Both camps will insist that the academic research – and real world experience – prove that “their way” beats the market over time. And both camps are absolutely right. Simple value screens like Joel Greenblatt ‘s ” Magic Formula ” have beaten the market by a wide margin, and research has shown that a strategy of screening stocks based on simple momentum criteria also beats the market over time. So if value works… and momentum works… what would it look like if we combined the two? Pretty good, actually. Quant guru Patrick O’Shaughnessy wrote an excellent piece last year in which he parses the universe of stocks into value and momentum buckets. Take a look at the following table, taken from O’Shaughnessy’s article. (click to enlarge) The bottom row of the table represents the top 20% of all stocks by momentum. The returns get gradually better as you move down the value scale. In other words, momentum stocks that are cheap outperform momentum stocks that are expensive. And it’s not by a small margin. The cheapest high-momentum stocks returned 18.5% per year, whereas the most expensive high-momentum stocks returned 11.6%. And viewing it through a value lens tells the same story. The right-most column represents the cheapest stocks in the sample using a composite of value metrics. All value-stock buckets performed well. But as you move down the column, the returns get a lot better. In other words, cheap stocks that have recently shown momentum perform better than cheap stocks that don’t. This is a fancier way of repeating the old trader’s maxim to never try and catch a falling knife. Cheap stocks can always get cheaper. What should we take away from this? Value investing works. Momentum investing works. And combining value and momentum works best of all. This article first appeared on Sizemore Insights as Value or Momentum? Try Both. Disclaimer: This site is for informational purposes only and should not be considered specific investment advice or as a solicitation to buy or sell any securities. Sizemore Capital personnel and clients will often have an interest in the securities mentioned. There is risk in any investment in traded securities, and all Sizemore Capital investment strategies have the possibility of loss. Past performance is no guarantee of future results. Original Post
It Is Not Possible That Valuations Matter Only At The Margins

By Rob Bennett You will often hear people say that valuations matter only at the margins. That is, valuations matter when prices are very high and when they are very low. Outside of that, it is okay to ignore the effect of valuations. I see this as dangerous thinking. My view is that either valuations matter or they do not. If they matter, they always matter. If they don’t matter, they never do. I am not able to make sense of the idea that valuations matter in some circumstances, but not in others. The first point that needs to be made is that there is a practical sense in which the claim that valuations only matter at the margins is true. Stocks generally offer a significantly better long-term value proposition than other asset classes. So, when stocks are priced at only a bit more than their fair value price, they remain a good investing choice. In a practical sense, then, a high stock allocation makes sense until the overvaluation reaches such a point that the mispricing is extreme. The problem is that there is no one valuation level at which stocks are transformed from a good choice to a bad one. Stocks are a little less appealing when the P/E10 level is 18 than they are when the P/E10 level is 15. And they are, of course, even less appealing when the P/E10 level is 21. And then even less appealing when the P/E10 level is 24. And even less appealing when the P/E10 level is 27. What is the investor to do? When does he lower his stock allocation, and by how much? It’s tricky. Stocks became a bit less appealing when the P/E10 level rose from 15 to 18, and then again when it moved from 18 to 21, and from 21 to 24, and from 24 to 27. But as the PE10 level moved from 15 to 27, the feedback being received by the investor was all positive. The risk of owning stocks was becoming greater. The investor should have been lowering his stock allocation in an effort to keep his risk profile constant. But at the moment when the P/E10 value reached the insane level of 27, the investor who failed to lower his stock allocation as the P/E10 value moved to 18, and then to 21, and then to 24, and then to 27 was feeling good about those decisions. So he was left disinclined to changing it much, even when prices had gone to “the margins” of 27 and above. What Jack Bogle says about this is that investors should not change their stock allocations in response to price increases. But if they feel that they absolutely must change their allocation at the margins, they should not lower them by more than 15 percent. Bogle has never explained how he came up with the 15 percent figure. I use the historical return data as my guide. The data shows that stocks are likely to offer an amazing long-term return when prices are at low levels or at fair value levels, and then the long-term return drops and drops as prices continue to rise. The data shows that most investors should have been going with a stock allocation of about 80 percent in the early 1990s and about 20 percent in the late 1990s and early 2000s. That’s a change not of 15 percentage points, but of 60 percentage points. Bogle’s recommendation is off by 400 percent, according to the 145 years of historical data available to us today. How many people know that? People don’t know how dangerous it is to own stocks when they are selling at high valuation levels, because most advisors buy into the idea that valuations matter only at the margins. If you only consider valuations at the margins, you are missing out on most of the story of how the mispricing of stocks derails investor retirement plans. Stocks don’t suddenly become dangerous when the P/E10 value hits 27. They are virtually risk-free when the P/E10 value is 15. Then, they become more risky at 18. And more risky at 21. And more risky at 24. And more risky at 27. Unfortunately, the growing risk is a silent one. Stocks are far more risky when the P/E10 value is 21 than they are when it is 15. But years can go by before that risk evidences itself in portfolio destruction. Valuation risk plays out the way that cancer risk plays out for people who smoke three packs of cigarettes each day. Heavy smokers often “get away” with their behavior for decades before they contract a disease that kills them. However, the deep reality is different from the surface one. Someone who smokes three packs of cigarettes each day from age 16 to age 66 and then dies at age 67 from lung cancer was not avoiding the risk of smoking for 50 years; he was avoiding only the practical consequences of taking on a risk that would one day cause him to pay a terrible price. Disclosure: None.

Using ETFs To Short The Market

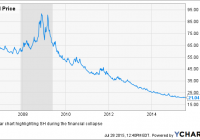
Summary The structure and pricing of inverse and leveraged ETPs is complicated. The principal investments of this fund are money market instruments and derivatives. Daily re-balancing can be a concern. Reading through recent Seeking Alpha articles regarding the broader market, lengthy and often heated discussions tend to develop on the direction of the market. That being said, it seems as if opinions on the eventual breakthrough of the current sideways trading range are about half and half, with maybe slightly more bulls. I also recently read comments on an article about leveraged and inverse exchange-traded products, where many readers did not seem to have a clear understanding of how (particularly) inverse ETPs are priced. In light of these two observations, I thought it pertinent to analyze how an inverse ETF is structured, for the benefit of investors who are considering investing in one in order to profit from potential downside movement. Due to the referenced uncertainty and volatility present in the overall market, I decided to use the ProShares Short S&P 500 ETF (NYSEARCA: SH ) as the subject matter for my analysis. SH is an inverse ETF that attempts to return -1x the return of the S&P 500 on a daily basis. How does it achieve inverse returns? SH achieves returns that are inversely correlated to the S&P 500 by investing in assets and derivatives that perform (or historically perform) well when the market is not performing well. There are four main investments used by ProShares in its inverse index ETFs, and these are: Swaps (derivative market) Futures (derivative market) U.S. Treasury Bills (money market) Repurchase Agreements (money market) Derivatives : The sale of swaps will benefit in a falling market, because the buyer of the swaps is required to pay the seller the amount that the underlying has fallen in price. Inverse exposure through futures is likely most often achieved by short-selling index futures. Money Market Instruments : The use of short-term Treasuries and other money market instruments relates to the fact that short-term debt historically performs inversely to the market. This is due to there being a “flight to safety” when the equity markets are falling. Daily Re-balancing: For periods longer than a single day, the Fund will lose money when the level of the Index is flat, and it is possible that the Fund will lose money even if the level of the Index falls. – SH Prospectus The effect of daily rebalancing is one of the primary misunderstandings regarding inverse or leveraged ETFs that I see on Seeking Alpha. People discuss how they will “invest” in a leveraged ETF and hold it for several weeks, months, or even years in some instances. It is important to recognize that this is not the intended purpose of this type of ETF. These are intended to be traded for short time periods. In order to maintain the proper leverage ratio, inverse returns, and index exposure, SH is rebalanced each day. What this means for an investor is simple to illustrate: Suppose that at the end of the trading day on Monday, you invest $1,000 in a -1x inverse ETF @ $100 per share. The ETF tracks an underlying index with a value of $5,000. At market close on Tuesday, the index has decreased 10% to $4,500. In turn, the ETF has risen 10% to $110. By the close on Wednesday, the index has recovered to the original $5,000 – a roughly 11.11% gain. In turn, the ETF now loses 11.11%, which brings the value of your position to $97.78. Even though the index is exactly the same value as it was when you initiated the position, your position has lost money. This effect is also known as beta slippage. Note: This could theoretically work to your advantage, should the opposite situation occur. Conclusion: Simply by looking at a chart of SH, you will see that if you had held it for the duration of the 2008 collapse, you would have indeed profited: ND data by YCharts However, the return ratio was not accurate, with SH gaining approximately 26.07% from 1st January, 2007 to the first peak and SPX losing approximately 43.25% in the same time frame. In short, an inverse ETF like SH can be a great way to hedge short-term volatility or for intra-day trading, but if an investor is looking to actually short an asset (in this case, the S&P 500) for a long-term position, then it is not the most effective way to do so. Hopefully, with a clearer understanding of how this ETF is structured, prospective investors can make better use of it as a tool for his or her portfolio. Disclosure: I/we have no positions in any stocks mentioned, and no plans to initiate any positions within the next 72 hours. (More…) I wrote this article myself, and it expresses my own opinions. I am not receiving compensation for it (other than from Seeking Alpha). I have no business relationship with any company whose stock is mentioned in this article. Additional disclosure: This article is not intended to offer a recommendation to buy or sell any particular asset, and does not reflect the author’s opinions on the direction of the market. It is simply intended to provide an overview of how a complicated but useful financial instrument works.