Tag Archives: investing ideas

Fidelity Low-Priced Stock Fund Just Keeps Chugging Along

Summary FLPSX has been a steady long-term performer easily beating its benchmarks. FLPSX is a low beta fund with a high Sharpe ratio. You get a 900+ stock globally diversified portfolio with a reasonable expense ratio. Overall Objective and Strategy The primary objective of Fidelity Low-Priced Stock Fund (MUTF: FLPSX ) is to seek capital appreciation by investing 80% of its assets in low-priced stocks (at or below $35), which often leads to investments in small- and mid-cap securities. It invests in both growth and value stocks. The fund looks for high-quality, growing companies that trade at bargain prices – e.g. companies with strong balance sheets and good free cash flow yield. Joel Tillinghast, who has managed the fund for over 25 years, has been quoted as saying “I’m only interested in stocks selling for 12 or 14 times earnings or less.” Fund Expenses The expense ratio for FLPSX is 0.82%, which is reasonable for a well-managed, global equity fund. The fund discourages active trading and is designed for long-term investing. It is a no-load fund, but it assesses a 1.50% redemption fee if the fund is held for less than 90 days. Minimum Investment FLPSX has a minimum initial investment of $2,500. Past Performance The fund is classified by Morningstar in the “Mid-Cap Value” or MV category. Compared with other mutual funds in this category, FLPSX has performed quite well. Here are the long-term performance figures computed by Morningstar: FLPSX Category (MV) Category Rank 15 Year 12.32% 8.76% 2% 10 Year 9.03% 7.32% 11% 5 Year 15.69% 14.08% 21% 3 Year 19.02% 18.11% 36% 1 Year 5.64% 1.16% 12% YTD 3.52% -0.34% 6% Source: Morningstar Mutual Fund Ratings Lipper Ranking : Funds are ranked based on total return within a universe of funds with similar investment objectives. The Lipper peer group is Small Cap. 1 Yr #520 out of 1,438 funds 5 Yr #431 out of 1,100 funds 10 Yr #174 out of 786 funds Morningstar Rating : Category is Mid-Cap value Overall 4 stars out of 429 funds 3 Yr 4 stars out of 429 funds 5 Yr 4 stars out of 370 funds 10 yr 4 stars out of 242 funds Fund Management Joel Tillinghast has been the primary fund manager since 1989. Over his 25+ years running the fund, it has beaten the Russell 2000 by a wide margin. After graduating from Wesleyan, he briefly worked for Value Line before being hired by Fidelity. FLPSX owns over 900 stocks and people at Fidelity have said that Tillinghast knows the details on every one of them. There is a large support team of six additional analysts who were hired to assist Tillinghast in 2011 when he took a brief leave of absence. Over time, the other analysts are taking over larger portions of the portfolio management. Top Ten Holdings (as of June 30, 2015) UnitedHealth Group (NYSE: UNH ) Next PLC Seagate Technology (NASDAQ: STX ) Best Buy (NYSE: BBY ) Microsoft (NASDAQ: MSFT ) Ross Stores (NASDAQ: ROST ) Metro, Inc. ( OTCPK:MTRAF ) Barratt Developments PLC ( OTC:BTDPY ) Unum Group (NYSE: UNM ) Aetna (NYSE: AET ) Asset allocation (as of June 30, 2015) Domestic Equities 54.75% International Equities 36.25% ——-Developed Markets 29.01% ——-Emerging Markets 7.24% Bonds 0.01% Cash 8.99% Fund Characteristics versus the Benchmark Index Valuation Portfolio Index Price/Earnings (1-Year Forecast) 14.1x 20.0x Price/Book 2.0x 2.3x Price/Cash Flow 10.4x 15.1x Return on Equity (5-Year Trailing) 16.2% 9.3% Comments Fidelity Low-Priced Stock Fund was first launched in December 1989 as a small-cap fund, and originally it required most new holdings to sell for $15 or less. It had a great record the first few years out of the box, and it attracted a lot of assets. Eventually, as assets under management grew, the price cap was lifted to $35, and the fund now owns more mid-cap and large-cap holdings. FLPSX is definitely not a benchmark hugger and owns many foreign stocks that are very small and have little analyst coverage. Some of the small foreign holdings do not even publish information in English. It also has large positions in Microsoft and UnitedHealth Group which are definitely not mid-cap stocks. One of the best features of FLPSX is its low volatility. Fidelity reported a recent beta of only 0.58 as of June 30. Because of the low beta and good performance, the fund has a high Sharpe ratio of 2.01, which measures return per unit of risk. I first purchased FLPSX back in 1990, and have been very pleased with its long-term performance. I only wish my initial purchase had been much larger. Because it is such a steady performer, it is the kind of fund you can buy and put away for the long term. Fund turnover is generally pretty low, so it can be a good holding for a taxable account or an IRA. I always find it interesting to read Joel Tillinghast’s quarterly performance reviews where he discusses which fund holdings added or subtracted from the fund’s performance. He also discusses how various sectors have done around the world. Disclosure: I am/we are long FLPSX. (More…) I wrote this article myself, and it expresses my own opinions. I am not receiving compensation for it (other than from Seeking Alpha). I have no business relationship with any company whose stock is mentioned in this article.
Does Diversifying Damage Performance?

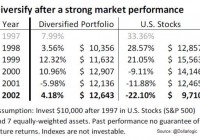
By Ronald Delegge During the 1849 California Gold Rush people sold all their possessions to chase gold. A small minority hit the jackpot, but most did not. Back then, the few people that did get wealthy by not diversifying were the hyper-extreme exception, not the rule. And it’s the same today. In retrospect, investors that overstuffed their portfolios on stocks like Amazon.com (NASDAQ: AMZN ), Netflix (NASDAQ: NFLX ), and other high-flyers have done well. Nonetheless, they’ve taken great financial risk that could’ve turned out to be catastrophic. The truth is that far more people have been damaged than helped by not diversifying their investment risk. History books are filled with people that lost everything by not diversifying. Of course, the history books are also filled with people that gained great wealth by not diversifying, but again, they are the hyper-extreme super rare exception – not the rule. And trying to join their ranks by risking everything you own is theoretically cute but drenched with hazard. Done Right An adequately diversified portfolio never concentrates market exposure to one or two asset classes, but rather spreads risk by maintaining exposure to the five core asset classes: stocks, bonds, real estate, commodities, and cash. Like a thermostat that remains on at all times, a core portfolio will always have exposure to these five major asset classes. Investors can dial up or dial down their exposure to each of these core asset classes based upon their investment goals, liquidity needs, and comfort level. Sadly, certain financial institutions and advisors – even so-called fiduciaries – operate under the false pretext they are “diversifying” client portfolios by overloading customers in “alternative investments” like illiquid securities and highly leveraged funds with juicy dividend yields. Furthermore, many of these same advisors habitually construct undiversified investment portfolios built entirely upon non-core assets like individual stocks, hedge funds, and other narrowly focused high risk securities. A Hedge for Ignorance? It’s been said that portfolio diversification is a hedge for ignorance. For anybody with this misinformed view, I’d like to familiarize you with Yale University’s endowment. Yale’s endowment returned 11% per annum over the 10 years ending June 30, 2014. Over that period, Yale’s return surpassed broad market results for U.S. stocks, which returned 8.4% annually along with U.S. bonds, which gained 4.9% annually. Even more impressive is how Yale’s endowment generated returns of 13.9% over the past two decades compared to the estimated 9.2% average return of college and university endowments. How did Yale do it? By diversifying investment risk across a variety of different assets like commodities, real estate, and stocks! Here’s the lesson: What worked for Yale can work for you. The table shown above, courtesy from our friends at Dollarlogic, further cements the point that diversification after a strong period of equity returns enhances rather than hurts a portfolio’s investment returns. Although a diversified portfolio underperformed the S&P 500 during the sizzling hot bull market from 1997 to 1999, a $10,000 diversified portfolio was worth more ($12,643) at the end of 2002 compared to just $9,710 for an all stock portfolio. In summary, portfolio diversification that is properly executed does not hinder but enhances risk-adjusted investment returns. Disclosure: No positions Link to the original post on ETFguide.com

Remember July 2011? The Stock Market’s Advance-Decline (A/D) Line Remembers

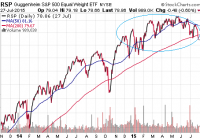
Paying a premium for growth is one thing. Chasing a handful of momentum stocks is another. Six corporations account for more than the entirety of the meager 2015 gains in the S&P 500. What happens when one examines the S&P 500 on an equal-weighted basis? Clearly, there is a dichotomy between the health of the overall stock market and the relatively high price of the popular benchmarks. According to Bloomberg data, the modest year-to-date increase in the S&P 500 is attributable to health care and retail alone. Worse yet, the two industry segments trade at a 20% premium to the market at large. Paying a premium for growth is one thing. Chasing a handful of momentum stocks is another. Brokerage firm Jones Trading sharpened the knife even further, noting that six corporations account for more than the entirety of the meager 2015 gains in the S&P 500. Those companies? Amazon (NASDAQ: AMZN ), Apple (NASDAQ: AAPL ), Facebook (NASDAQ: FB ), Gilead (NASDAQ: GILD ), Google (NASDAQ: GOOG ) and Walt Disney Co (NYSE: DIS ). The narrowing of the market itself coupled with the types of businesses on the list (with the possible exception of Walt Disney) strongly resembles late 1990s euphoria . What happens when one examines the S&P 500 on an equal-weighted basis? We find that that stocks have been stuck in one of the tightest trading ranges in market history for as long as the Federal Reserve ended quantitative easing (“QE3″). Here is the performance of the Guggenheim S&P Equal Weight ETF (NYSEARCA: RSP ) since QE3 wrapped up at the end of October in 2014. The ongoing deterioration in the S&P 500’s Bullish Percentage Index (BPI) underscores the challenges that investors face. Do they chase the Googles and the Gileads? Do they look for value in the energy patch through acquiring beaten down exchange-traded proxies like the Energy Select Sector SPDR ETF (NYSEARCA: XLE )? Or do they recognize that 50% of the S&P 500 components are currently in downtrends – a demarcation that is unfavorable for the long-term sustainability of the 3rd longest bull in history. Clearly, there is a dichotomy between the health of the overall stock market and the relatively high price of the popular benchmarks. Addressing the internal components of major benchmarks like the S&P 500, Dow Jones Industrials, NYSE Composite or NASDAQ as they relate to the handful of momentum leaders in those benchmarks leaves one to ponder what will happen next. Will the weight of the overall market crush the Atlas-like performance of health and retail? On the flip side, is it possible that underachieving sectors like industrials, materials, energy, utilities, transports and telecom might join the winner’s circle? Unfortunately, history suggests that overvalued sectors tend to crumble and join the beleaguered areas, as opposed to the troubled spots catching a bid first. Indeed, the last time that the New York Stock Exchange’s Advance Decline Line (A/D) Line fell below a 200-day moving average, the broader S&P 500 fell more than 19%. It occurred in July of 2011 as the euro-zone crisis had been spiraling out of control. For those that believe the illusion of economic acceleration could help the cause, media spin and double seasonally adjusted GDP reporting will not help. The reality of a lusterless U.S. economy is far too great. The manufacturing, mining, and utilities that collectively comprise the industrial sector recently registered its weakest year-over-year growth in a half-decade. Wholesale sales have dropped steadily over the past four years. Exporting on a strong dollar has been difficult for those multi-nationals that operate in Asia and Europe. Wage growth has been stuck in and around 2% since the end of the Great Recession in 2009. The workforce participation rate – a measure of actual employment – is as poor as it had been in the recession-weary late 70s. And homeownership at 63.4% is the lowest that it has been since 1967. What about the consumer? Aren’t people feeling wealthier? I suppose this depends upon the people you ask. The Conference Board’s U.S. Consumer Confidence was about as discouraging a data point as anyone has seen lately. Consumer expectations plummeted from 92.8 to 79.9 – the lowest reading since February 2014. And Gallup’s reading last week wasn’t much better; that is, for whatever reason, Americans believe the economy is getting worse. As long as the Federal Reserve maintains its plan to raise the cost of borrowing, and as long as the U.S. dollar rises alongside those expectations, the broader market is likely to remain range-bound. You’d have to hold the horses that have been winning, like the iShares S&P 100 ETF (NYSEARCA: OEF ) and the Health Care Select Sect SPDR ETF (NYSEARCA: XLV ). Yet you wouldn’t necessarily want to add to your overall equity position. You might also want to avoid areas of the market that are weakening in the face of higher borrowing costs and a higher greenback. The Industrial Select Sector SPDR ETF (NYSEARCA: XLI ) have gone nowhere in the nine months since QE3 officially ended. Click here for Gary’s latest podcast. Disclosure: Gary Gordon, MS, CFP is the president of Pacific Park Financial, Inc., a Registered Investment Adviser with the SEC. Gary Gordon, Pacific Park Financial, Inc, and/or its clients may hold positions in the ETFs, mutual funds, and/or any investment asset mentioned above. The commentary does not constitute individualized investment advice. The opinions offered herein are not personalized recommendations to buy, sell or hold securities. At times, issuers of exchange-traded products compensate Pacific Park Financial, Inc. or its subsidiaries for advertising at the ETF Expert web site. ETF Expert content is created independently of any advertising relationships.