Tag Archives: investing ideas

Vanguard Wellesley Income Fund: The Reverse Of Wellington

Having written about VWELX, a reader asked my take on sister fund VWINX. The two are pretty much the reverse of each other. That, in the end, winds up being a risk issue for potential investors. A lot of investors look at bonds as a way to generate income. And that’s true. But in an asset allocation model, they are also a way to provide diversification and stability. In other words, a big part of owning bonds is safety. And that’s where a comparison of value-focused Vanguard Wellesley Income Fund (MUTF: VWINX ) and Vanguard Wellington Fund (MUTF: VWELX ) leads to some interesting findings. One down, now for number two I recently wrote an article about Vanguard Wellington . Within the comments, a reader asked if I would also take a look at sister fund Vanguard Wellesley. The comparison of the two is actually pretty interesting and highlights an important aspect of investing: risk. Wellington’s portfolio goal is to actively invest in stocks and bonds with a mix of roughly two-third stocks and one-third bonds. There’s a band around those percentages since it’s an actively managed fund, but it generally keeps pretty close to its goals. Sister fund Wellesley’s goal is the mirror image, one-third in stocks and two-thirds in bonds. And what that means for performance is very important. For example, as you might expect, Wellington outperforms bond-heavy Wellesley over the trailing one-, three-, five-, 10-, and 15-year periods through June on an annualized total return basis. That said, over the longer periods, the numbers start to get pretty close. There’s just 30 basis points or so separating the two funds over the 15-year period and around one percentage point over the trailing decade. But, the trend is intact, the fund with more stocks does, indeed, do better on an absolute basis. Interestingly, the income both funds generate is pretty close, too. Wellesley’s trailing 12-month yield is a touch under 3%. Wellington’s yield is roughly 2.5%. To be fair, a good portion of that has to do with the current low rate environment. In a different period, with higher interest rates, I would expect Wellesley’s yield advantage to be larger. But what about risk? But return and distributions aren’t the only factors to consider. Bonds are also about risk control. And on that score, these two funds have very different profiles. For example, over the trailing three years, Wellington’s standard deviation, a measure of volatility, is around 5.5. That’s a pretty low standard deviation. However, Wellesley’s number is an even lower 4. For most conservative investors, either of those two figures would be agreeable. Looking out over longer periods starts to show a bigger gap. For example, over the trailing 15-year period, Wellesley’s standard deviation is roughly 6 and Wellington’s is around 9.5. That’s a more meaningful difference. And remember that the two funds had very similar performance numbers over that span. Thus, over the trailing three years, Wellington’s Sharpe ratio of 2, a figure that measures the amount of return relative to the amount of risk taken, outdistances Wellesley’s 1.7. But over the trailing 15 years, those numbers flip, with Wellesley’s Sharpe ratio of 1 outdistancing Wellington’s 0.7 or so. Since performance over that longer term is so close, the big reason for the difference here is risk. Who’s right for what? At the end of the day, the two funds are both good options for conservative investors looking for a balanced fund. The biggest difference is really in the investor’s desire for safety. If the higher bond component in Wellesley will help you sleep better at night, then you should probably go with the more conservative of these two funds. If you don’t find solace in having more bonds in your portfolio, go with Wellington – noting that the choice is likely to lead to a slightly higher risk profile. That said, there’s a caveat. Interest rates are at historic lows. Bond prices and interest rates move in opposite directions. So when rates go down, bond prices go up. That’s been a tailwind for Wellesley for quite some time. If rates start to move higher quickly, however, that could turn into a headwind because as rates go up, bond prices go down. Wellesley’s higher debt component will mean rising rates are a bigger issue for the fund than for its sibling. However, both funds are run by the same management company and have been around a long time. They have dealt with shifting interest rates before. So this is something to keep in mind, but I wouldn’t let it deter me from purchasing either of these two well-run funds if my goal was to own them for a long time. Disclosure: I/we have no positions in any stocks mentioned, and no plans to initiate any positions within the next 72 hours. (More…) I wrote this article myself, and it expresses my own opinions. I am not receiving compensation for it (other than from Seeking Alpha). I have no business relationship with any company whose stock is mentioned in this article.
The Oil Crash: 3 ETFs For Targeted Investment In The Energy Sector

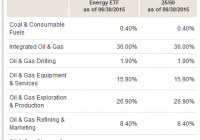
Summary My breakfast reading this morning was an article from a fellow Seeking Alpha author suggesting that bargains could be found in the energy sector. While disagreeing with nothing in his article, I wondered what I could offer an investor who might be interested in using ETFs for a diversified investment in the sector. I came up with three solid candidates. This article will provide a brief overview. As a Seeking Alpha author myself, as time allows I enjoy reading as many articles as I can from fellow authors. My breakfast reading this morning included this article from fellow Seeking Alpha author Regarded Solutions . I think it is a great article, and well worth taking the time to read it for yourself. Essentially, though, the premise was as follows: The energy sector has been killed recently, due to the low price of oil. However, unless one believes in the imminent demise of oil and all its uses, now may be a good time to at least look at scaling into bargains. In particular, the author recommends taking a hard look at Exxon Mobil (NYSE: XOM ). Before I go any further, let me be explicit that it is not the purpose of my article to either dispute any of the points in his article nor to diminish anyone’s interest in purchasing shares in Exxon Mobil. However, I am ETF Monkey, after all. “What,” I thought, “might I suggest to the person who liked the concept, but wished to employ the power of ETFs to diversify their risk, as well as possibly invest in small, incremental chunks?” My research led to three quality candidates: Vanguard Energy ETF (NYSEARCA: VDE ) Energy Select Sector SPDR Fund (NYSEARCA: XLE ) iShares U.S. Energy ETF (NYSEARCA: IYE ) Let’s take a quick look at each ETF, and then I will offer a couple of concluding comments at the end. Vanguard Energy ETF Let’s start with some relevant data from the current factsheet . VDE has an inception date of 9/23/04, so has been around for almost 11 years. It tracks the MCSI USA Energy IMI 25/50 Index . As of 6/30/15, the fund contains 151 stocks, compared to 149 in the index. It has $5.0 billion in Assets Under Management (AUM). In classic Vanguard fashion, it carries a very low .12% expense ratio and has an average spread of .03%, very good performance for a sector-specific ETF. Finally, it carries a 30-day SEC yield as of 7/27/15 of 2.76%. Here is a look at the sector breakdown: Next, let’s have a look at the Top 10 holdings, after which I will offer a couple of comments. (click to enlarge) I’d just like to draw your attention to a couple of things: You may have noted that Exxon Mobil is the fund’s top holding, at 21.3%. In other words, for every $1,000 you invest, you are essentially investing $213 in Exxon Mobil. Even though there are 151 stocks in the portfolio, the Top 10 comprises 62.1% of total net assets. This is a much higher concentration than a broader market index ETF, such as the Vanguard Total Stock Market ETF (NYSEARCA: VTI ), for which the Top 10 holdings only comprise 14.4% of total net assets. However, in this context, this is a good thing. You are still making a very targeted investment in a sector, while still retaining a measure of defense against single-entity risk . Within the sector, the major portion of your funds are in developed, established companies. Energy Select Sector SPDR Fund Again, let’s start with relevant data from the latest factsheet . XLE, from State Street Global Advisors (NYSE: STT ), one of the oldest providers of ETFs, has an inception date of 12/16/1998. It tracks the S&P Energy Select Sector Index . As of 6/30/15, the fund contains 42 stocks, compared to 40 in the index. It has $11.6 billion in AUM. The fund carries a very competitive .15% expense ratio and has an average spread of .01%, which is truly exemplary for a sector-specific ETF. Finally, it carries a 30-day SEC yield as of 7/27/15 of 2.89%. Here are the fund’s Top-10 holdings: A couple of notes: Despite the far smaller number of stocks in XLE vs. VDE (40 vs. 151), the Top 10 concentration is virtually the same; 61.64% for XLE vs. 62.10% for VDE. At the same time, Exxon Mobil’s weighting is “only” 16.38% here vs. 21.30% in VDE. Therefore, your decision between the two may at some level hinge on how much concentration you wish to have in Exxon. iShares U.S. Energy ETF As always, some relevant data from the latest factsheet . IYE, from BlackRock, Inc. (NYSE: BLK ), has an inception date of 6/12/00. It tracks the Dow Jones U.S. Oil & Gas Index . As of 6/30/15, the fund contains 92 stocks, compared to 93 in the index. It is the smallest of the three ETFs, with $1.27 billion in AUM. The fund has an average spread of .03%, and carries a 30-day SEC yield as of 6/30/15 of 2.50%. Unfortunately, IYE also carries an expense ratio of .45%, meaning that the fund would need to outperform our two competitors by some .3% per year to overcome the handicap from expenses. Here are the fund’s Top-10 holdings: My thoughts: IYE is in the middle of the pack in terms of diversification, with 92 holdings. It’s Top 10 concentration is the greatest of the three ETFs, at 63.69%. Its weighing in Exxon Mobil is also the highest of the three; at 22.57% vs. VDE’s 21.30% and XLE’s 16.38%. Again, this may factor into your decision if you desire a heavier weighting in Exxon. Comparative YTD Performance As featured in the article that inspired this offering, the energy sector has been hit hard recently. That being the case, how have our three ETFs performed? Have a look: VDE data by YCharts As you can see, VDE and XLE are in a virtual dead heat, with only .1% separating them. It becomes basically a tie when you factor in XLE’s slightly higher 2.89% vs. 2.76% SEC yield. Summary and Conclusion Based on my examination, I am going to call it a tie between VDE and XLE. Both have long track records. Both have impressive amounts of AUM. And both have very competitive expense ratios which, all other things being equal, ultimately puts money in your pocket. As always, though, I will include the caveat that the question of which ETF you can trade commission-free may factor into your ultimate decision, particularly if you wish to make multiple small, incremental investments. My thanks to Regarded Solutions for a wonderful inspiration, and to all of you for reading. Happy investing! Disclosure: I/we have no positions in any stocks mentioned, and no plans to initiate any positions within the next 72 hours. (More…) I wrote this article myself, and it expresses my own opinions. I am not receiving compensation for it (other than from Seeking Alpha). I have no business relationship with any company whose stock is mentioned in this article. Additional disclosure: I am not a registered investment advisor or broker/dealer. Readers are advised that the material contained herein should be used solely for informational purposes, and to consult with their personal tax or financial advisors as to its applicability to their circumstances. Investing involves risk, including the loss of principal.

Timing Is Everything

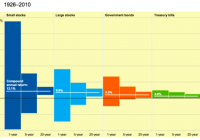
The length of time investors have to plan for is the single most powerful factor in their investment process. If time is short, investments with the highest potential return are the least desirable, because they entail the greatest risk. But given enough time, assets that appear risky become desirable. Time transforms investments from least attractive to most attractive – and vice versa. Our time horizon has a major impact on our investment strategy. This is true in the natural world as well. I’ve been to the coastal redwoods in California, and they’re awesome. John Steinbeck called them “ambassadors from another time.” In many ways, they are. They regularly reach ages of 600 years or more, and some are over 2000 years old. Their natural resistance to disease and insects allows them to grow slowly and gradually. But they have to. The high rainfall in their coastal habitat leaves the soil with few nutrients. By contrast, stumbling into a thicket of pin cherries in the Northeast woods can leave you breathless, but in a different way. The undergrowth can be so thick it’s easy to get disoriented. Pin cherry trees sprout and grow quickly, taking advantage of any disturbance in the forest canopy. But they only live 20 to 40 years, and they’re an important source of food for many types of animals. It would be foolish to say that either tree is more successful. Each has adapted to its environment. What works in one context doesn’t work in another. That’s why, for investors, the typical time period we use to calculate returns – one year – may be misleading. A single year simply doesn’t match the time available to different investors with their differing objectives and constraints. Different assets – and asset mixes – are appropriate in different circumstances. (click to enlarge) Average return and dispersion of return for various asset classes over different time periods, 1926-2010. Source: Jay Sanders, CPA So if you’re worried about the market, be sure to ask yourself how much time you have until you need the money. Because the quickest way to turn a temporary fluctuation into a permanent loss is to sell the asset. Share this article with a colleague