Wintergreen Takes An Evergreen Approach To Stock Selection
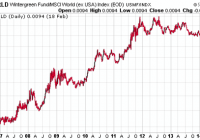
Summary WGRNX is a go anywhere fund with a current focus on Asia’s emerging middle class. Manager David Winters looks for companies showing a trifecta of strong management, improving situation and undervalued shares. The biggest drawback to the fund is the 1.85% expense ratio. Established in 2005, the two-star Morningstar rated Wintergreen Investor Fund (MUTF: WGRNX ) is a world stock category fund that seeks capital appreciation. The fund invests in stocks or convertible securities that manager David Winters believes are available at a discount to their intrinsic value. The fund invests in domestic and foreign issues of any size, including those from emerging markets. Investment Strategy Investment manager David Winters identifies securities through extensive analysis that includes book value, cash flow and earnings multiples. The goal is to select stocks that constitute what the fund manager calls a “trifecta.” These are stocks with good value issued by companies with shareholder-oriented management that are demonstrating improved business operations. The portfolio typically holds around 30 individual positions for the long-term while attempting to minimize turnover. This strategy often leads to owning shares in cash-rich companies that pay dividends or buy back shares. Shares are sold when valuation targets are met. The fund typically maintains 10 percent cash in order to capitalize on opportunities as they occur. WGRNX may invest in arbitrage opportunities that result from mergers, acquisitions, spin offs and consolidations as well as tender offers and liquidations. In addition to arbitrage opportunities, the fund may also take an activist role if the team anticipates that this position will benefit the investment. To minimize risk, the manager may engage in hedging strategies, such as owning gold and foreign currency swaps, purchasing put or call options and shorting stocks. Portfolio Composition The $1.5 billion fund held 14.91 percent of assets in cash as well as 33.01 percent in domestic stocks and 51.79 percent in foreign issues at the end of 2014. Mr. Winters believes that U.S. stocks are overvalued. As a result, the fund’s foreign stock and cash positions are higher relative to the category average and the domestic stock position is lower. The foreign issues have a slight tilt toward Developed Europe. The Asian share portion of the portfolio includes emerging and developed markets minus Japan. The portfolio has a market cap distribution on 55.95 percent giant, 34.49 percent large and 4.87 mid-cap stocks as well as a total 4.72 percent stake in small and micro-cap stocks. The fund is overweight consumer cyclical and consumer defensive stocks and underweight financials and healthcare. It does not hold any shares in the telecom or utility sectors. The fund’s aggressive and concentrated portfolio is a reflection of Mr. Winter’s belief that few companies meet Wintergreen’s stringent investment criteria. Only one category fund has a lower average debt/capital ratio and a higher average return on equity. The portfolio has a P/E ratio of 17.21, a price-to-book ratio of 2.70 and a dividend yield of 2.02 percent. Historical Performance and Risk WGRNX has beaten the MSCI World ex-USA Index since inception. Morningstar gives the fund a downside capture ratio of 57.22 percent over the past 5 years, and this performance reflects the fund’s resilience during down markets due to its preference for low-debt companies that have high relative cash positions. WGRNX has a low return rating from Morningstar. It has delivered 1-, 3- and 5-year total returns of 2.37 percent, 6.40 percent and 9.23 percent respectively. This compares to the index averages of 0.77 percent, 6.76 percent and 6.29 percent for the same periods. WGRNX has a below average risk rating from Morningstar as well as a three-year beta and standard deviation of 1.70 and 10.44. The category beta and standard deviation for the same period are 0.76 and 10.85. (click to enlarge) Fees and Expenses With a 1.85 percent total expense ratio, WGRNX is an expensive fund. This expense ratio is higher than 95 percent of funds in the no-load world stock category. The fund also has a 60-day redemption fee of 2 percent and a 12b-1 fee of 0.25 percent. Initial minimum investments are $10,000 for taxable accounts, $3,000 for an IRA and $2,000 for a Coverdell ESA. Fund Outlook WGRNX has a high quality portfolio and strong cash position that makes it well prepared for the next market correction. Winters also keeps turnover low at 12 percent of assets, but this buy-and-hold approach has cost it in the short-term. The fund remains focused on Asia with a concentration on consumer-oriented shares. Top 10 holdings Wynn Macau and Swiss timepiece manufacturer Swatch are plays on Asia’s emerging middle class, and the crackdown on corruption in China, as well as the ongoing economic slowdown there, weighed on results in 2014 as luxury sales declined. Another top 10 holding, Canadian Natural Resources (NYSE: CNQ ), has been battered by the plunge in oil prices. WGRNX should continue to be less volatile than other funds in the world stock fund category. Wintergreen’s continued focus on a sound investment strategy relative to strong business franchises with little debt and Mr. Winters’ conservative stock-picking acumen should enable WGRNX to sustain its strong relative performance in the long-term. A positive not captured in financial data is David Winters’ shareholder advocacy. He’s been a vocal critic of Coca-Cola (NYSE: KO ) management (see his recent interview on Fox Business ) over issues such as compensation and poor operating results. Investors in WGRNX are getting a manager who looks out for their interests all the way to the boardroom. The big stumbling block is the fees, which are too high at 1.85 percent of assets. Investors are starting each year nearly 2 percent behind the category and index, and performance hasn’t been consistently strong enough to justify those fees yet. Unfortunately, there aren’t similar portfolios out there. A fund such as Matthews Asian Growth and Income Fund (MUTF: MACSX ) offers exposure to Asia’s rising middle class, but it doesn’t offer the same exposure via blue chip multinationals offered by WGRNX. Some ETFs such as the iShares MSCI Emerging Markets Consumer Discretionary Sector Index ETF (NASDAQ: EMDI ) also tap into similar themes, but without an Asian focus. The Guggenheim China Small Cap ETF (NYSEARCA: HAO ) offers exposure to Chinese consumers, but only Chinese consumers. Investors can replicate some of the exposure in WGRNX with ETFs such as the iShares Global Consumer Staples ETF (NYSEARCA: KXI ) and the Market Vectors Gaming ETF (NYSEARCA: BJK ). Disclosure: The author has no positions in any stocks mentioned, and no plans to initiate any positions within the next 72 hours. (More…) The author wrote this article themselves, and it expresses their own opinions. The author is not receiving compensation for it (other than from Seeking Alpha). The author has no business relationship with any company whose stock is mentioned in this article.